Aerosol distribution plotting
import pandas as pd
import numpy as np
import seaborn as sns
import matplotlib.pyplot as plt
from matplotlib.colors import LogNorm
#import matplotlib.dates as mdates
%matplotlib inline
filename = "shared-ns1000k/inputs/Aerosol_sizedist_obs/Zeppelin_2010_hourly.csv"
mydateparser = lambda x: pd.datetime.strptime(x, "%Y %m %d %H %M")

data = pd.read_csv(filename,  parse_dates=[['0', '0.1', '0.2', '0.3', '0.4']], date_parser = mydateparser)
data.rename(columns={'0_0.1_0.2_0.3_0.4':'date'}, inplace = True)
data.head()
data = data.set_index('date')
data.replace(to_replace=-999, value = np.nan, inplace=True)
# Remove last column
data.drop(labels='0.6', axis=1, inplace=True)
# Transpose data, remove missing values and invert Y axis (to get increasing values)
s = data.T.iloc[::-1].dropna(axis=1)
s.head()
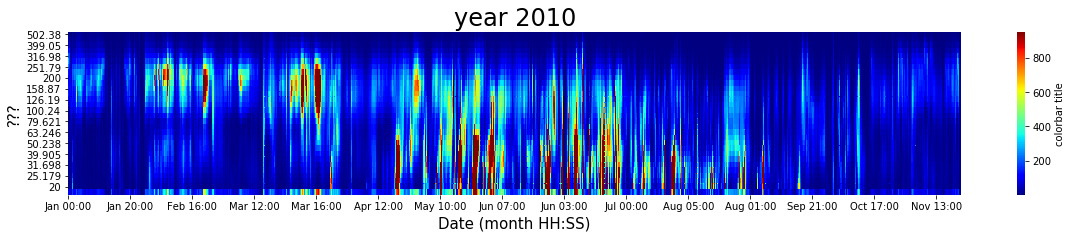
fig = plt.figure(1, figsize=[20,3])

LOGMIN = 0.1  # a priori chosen appropriate for log-scaled data display
ax = plt.subplot(1, 1, 1)
cax = sns.heatmap(s,cmap='jet',  ax=ax, xticklabels=500, norm=LogNorm(),
                  vmin = max(s.values.min(), LOGMIN), vmax = s.values.max(),
                  cbar_kws={"ticks":[0,1,10,1e2,1e3,1e4,1e5], 'label': 'colorbar title'})

labels = [datetime.strptime(item.get_text(), '%Y-%m-%dT%H:%M:%S.%f000').strftime("%b %H:%M") for item in cax.get_xticklabels()]
cax.set_xticklabels(labels, rotation=10)
cax.set_title('year ' + str(data.index.year.unique().values[0]), fontsize=24)
cax.set_ylabel('???', fontsize = 15)
cax.set_xlabel('Date (month HH:SS)', fontsize = 15)
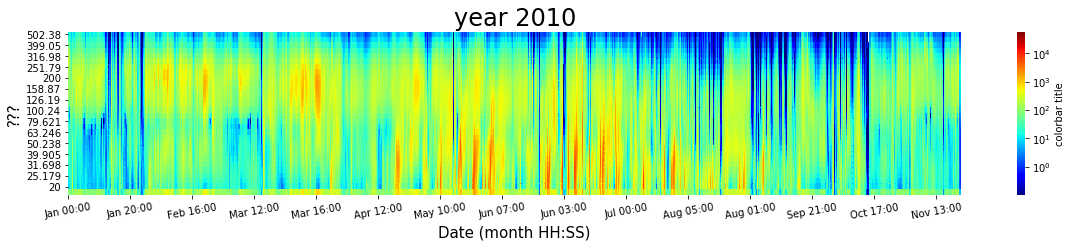
fig = plt.figure(1, figsize=[20,3])

ax = plt.subplot(1, 1, 1)
# robust: If True and vmin or vmax are absent, the colormap range is computed with robust quantiles instead of the extreme values.
cax = sns.heatmap(s,cmap='jet', ax=ax, xticklabels=500,
                  cbar_kws={'label': 'colorbar title'}, robust=True)

labels = [datetime.strptime(item.get_text(), '%Y-%m-%dT%H:%M:%S.%f000').strftime("%b %H:%M") for item in cax.get_xticklabels()]
cax.set_xticklabels(labels, rotation=0)
cax.set_title('year ' + str(data.index.year.unique().values[0]), fontsize=24)
cax.set_ylabel('???', fontsize = 15)
cax.set_xlabel('Date (month HH:SS)', fontsize = 15)