Example CMIP6 colocation
import pyaerocom as pya
from warnings import filterwarnings
filterwarnings('ignore')
pya.__version__
pya.const.BASEDIR = '/home/notebook/shared-ns1000k/inputs/pyaerocom-testdata/'
CMIP6_TEST_DIR = '/home/notebook/shared-cmip6-for-ns1000k/hist-aer/HadGEM3-GC31-LL/r1i1p1f3/'
CMIP6_TEST_FILE = 'od550aer_AERmon_HadGEM3-GC31-LL_hist-aer_r1i1p1f3_gn_195001-202012.nc'
path = CMIP6_TEST_DIR + CMIP6_TEST_FILE
modeldata = pya.GriddedData(path, var_name='od550aer')
modeldata.metadata['ts_type'] = 'monthly' # needed for colocation
modeldata.ts_type
modeldata.start
modeldata.stop
obsdata = pya.io.ReadUngridded().read('AeronetSunV3Lev2.daily', 'od550aer')
coldata = pya.colocation.colocate_gridded_ungridded(modeldata, obsdata, ts_type='monthly', start=2010)
coldata.plot_scatter(marker='o', color='blue', alpha=0.1);
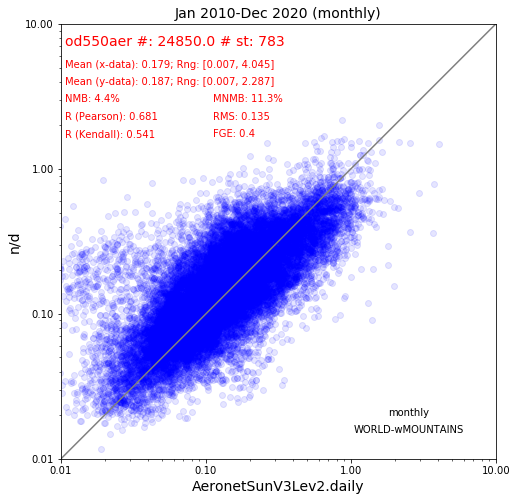
coldata.calc_statistics()
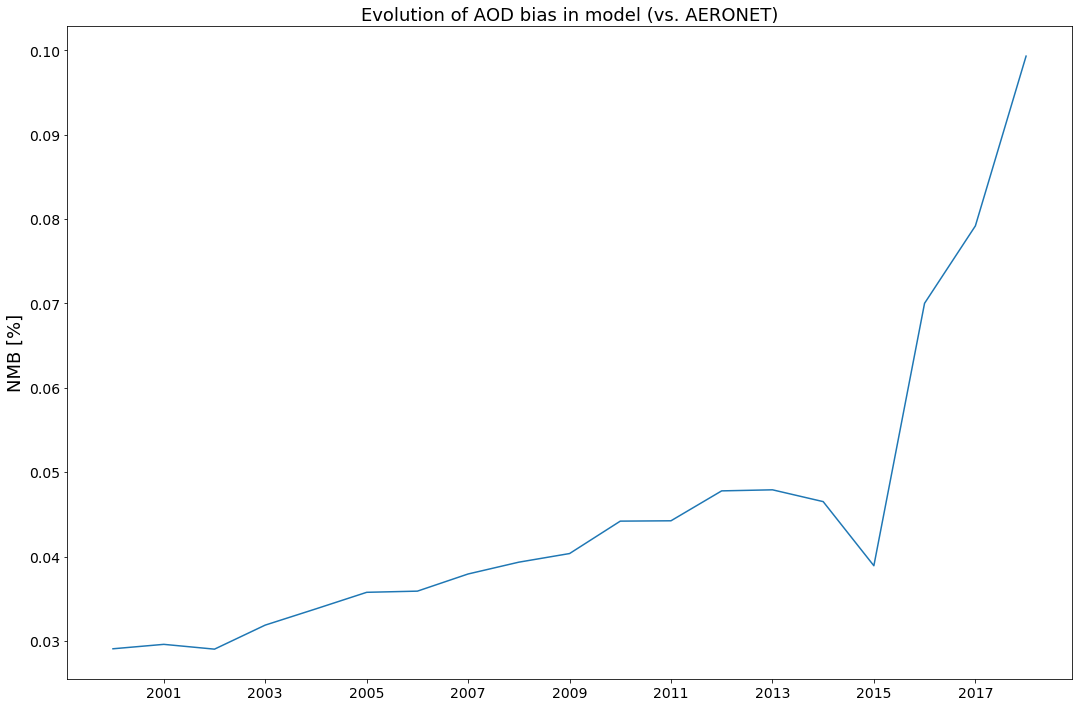
Trend in bias ?
NOTE: the following code may not work for you due to memory requirements (we will work on this)
import numpy as np
years = np.arange(2000, 2019)
years
from IPython.display import clear_output
nmb_result = []
for year in years:
    clear_output()
    print('Processing year {}'.format(year))
    try:
        _coldata = pya.colocation.colocate_gridded_ungridded(modeldata, obsdata,
                                                             ts_type='monthly',
                                                             start=year)
        _stats = _coldata.calc_statistics()
        nmb_result.append(_stats['nmb'])
    except Exception as e:
        nmb_result.append(np.nan)
        print('Colocating failed. Reason: {}'.format(repr(e)))
tidx = [pya.helpers.to_datetime64(x) for x in years]
tidx
import matplotlib.pyplot as plt
fig, ax = plt.subplots(1,1, figsize=(18, 12))
ax.plot(tidx, nmb_result);
ax.set_ylabel('NMB [%]')
ax.set_title('Evolution of AOD bias in model (vs. AERONET)')