Search
How to read EBAS files

How to read EBAS NASA Ames file with pyaerocom

  • Either, find files that are available in the provided database, as explained in HOWTO_find_EBAS_files, OR:
  • Download (and unzip) the NASA Ames files (.nas) you need from EBAS database (shown below)
import pyaerocom as pya
ls EBAS_FILES/
NO0042G.20050101000000.20120101000000.aws.wind_speed.met.1y.1h.NO01L_NO42_aws_10m.NO01L_cup_anemometer..nas

Pick the file and put parse it into the EbasNasaAmesFile object to read it

fpath = 'EBAS_FILES/' + 'NO0042G.20050101000000.20120101000000.aws.wind_speed.met.1y.1h.NO01L_NO42_aws_10m.NO01L_cup_anemometer..nas'
filedata = pya.io.EbasNasaAmesFile(fpath)
print(filedata)
Pyaerocom EbasNasaAmesFile
--------------------------

num_head_lines: 52
num_head_fmt: 1001
data_originator: Aas, Wenche
sponsor_organisation: NO01L, Norwegian Institute for Air Research, NILU, Atmosphere and Climate Department, Instituttveien 18, , 2007, Kjeller, Norway
submitter: Hjellbrekke, Anne
project_association: EMEP NILU
vol_num: 1
vol_totnum: 1
ref_date: 2005-01-01T00:00:00
revision_date: 2012-01-01T00:00:00
freq: 0.041667
descr_time_unit: days from file reference point
num_cols_dependent: 3
mul_factors (list, 3 items): ['1.00', '1.00', '1.00']
vals_invalid (list, 3 items): ['1000', '1000', '10.00']
descr_first_col: end_time of measurement, days from the file reference point

   Column variable definitions
   -------------------------------
   EbasColDef: name=starttime, unit=days, is_var=False, is_flag=False, flag_col=3, 
   EbasColDef: name=endtime, unit=days, is_var=False, is_flag=False, flag_col=3, 
   EbasColDef: name=wind_speed, unit=m/s, is_var=True, is_flag=False, flag_col=3, 
   EbasColDef: name=numflag wind_speed, unit=no unit, is_var=False, is_flag=True, flag_col=None, 

   EBAS meta data
   ------------------
data_definition: EBAS_1.1
set_type_code: TU
timezone: UTC
file_name: NO0042G.20050101000000.20120101000000.aws.wind_speed.met.1y.1h.NO01L_NO42_aws_10m.NO01L_cup_anemometer..nas
file_creation: 20191018095601
startdate: 20050101000000
revision_date: 20120101000000
statistics: arithmetic mean
data_level: 
period_code: 1y
resolution_code: 1h
station_code: NO0042G
platform_code: NO0042S
station_name: Zeppelin mountain (Ny-Ålesund)
station_wdca-id: GAWANO__ZEP
station_gaw-id: ZEP
station_gaw-name: Zeppelin Mountain (Ny Ålesund)
station_land_use: Gravel and stone
station_setting: Polar
station_gaw_type: G
station_wmo_region: 6
station_latitude: 78.90715
station_longitude: 11.88668
station_altitude: 474.0m
regime: IMG
component: wind_speed
unit: m/s
matrix: met
instrument_type: aws
laboratory_code: NO01L
instrument_name: NO42_aws_10m
method_ref: NO01L_cup_anemometer
originator: Aas, Wenche, waa@nilu.no, Norwegian Institute for Air Research, NILU, Atmosphere and Climate Department, Instituttveien 18, , 2007, Kjeller, Norway
submitter: Hjellbrekke, Anne, agh@nilu.no, Norwegian Institute for Air Research, NILU, Atmosphere and Climate Department, Instituttveien 18, , 2007, Kjeller, Norway

   Data
   --------
[[0.00000000e+00 4.16670000e-02 9.00000000e-01 0.00000000e+00]
 [4.16670000e-02 8.33330000e-02 7.00000000e-01 0.00000000e+00]
 [8.33330000e-02 1.25000000e-01 1.20000000e+00 0.00000000e+00]
 ...
 [3.64875000e+02 3.64916667e+02 1.80000000e+00 0.00000000e+00]
 [3.64916667e+02 3.64958333e+02 1.60000000e+00 0.00000000e+00]
 [3.64958333e+02 3.65000000e+02 2.20000000e+00 0.00000000e+00]]
Colnum: 4
Timestamps: 8760

The data has 4 columns and 8760 timestamps. All attributes can be accessed via . or [].

filedata['station_longitude']
'11.88668'

Note: as you can see, numerical metadata like longitude, etc. is not converted into floating point but kept as string! You can do:

float(filedata['station_longitude'])
11.88668

Information about each data column in the file

The NASA Ames files have multiple columns of data (here 4), in order to find the columns you need you can check the var_defs attr., which is a list with column information where the index corresponds to the index of the data column.

filedata.var_defs
[EbasColDef: name=starttime, unit=days, is_var=False, is_flag=False, flag_col=3, ,
 EbasColDef: name=endtime, unit=days, is_var=False, is_flag=False, flag_col=3, ,
 EbasColDef: name=wind_speed, unit=m/s, is_var=True, is_flag=False, flag_col=3, ,
 EbasColDef: name=numflag wind_speed, unit=no unit, is_var=False, is_flag=True, flag_col=None, ]

E.g. as you can see, the 3rd column (index=2) contains wind speed data:

COL_WINDSPEED = 2

The actual table data is stored as 2D numpy array under data

NOTE: order of indices in data are: ROW, COL

So to get the windspeed column data:

wind_data = filedata.data[:, COL_WINDSPEED]
wind_data
array([0.9, 0.7, 1.2, ..., 1.8, 1.6, 2.2])

Time stamps are available via time_stamps attr (as numpy.datetime64 objects, i.e. ready for analysis)

filedata.time_stamps
array(['2005-01-01T00:30:00', '2005-01-01T01:29:59',
       '2005-01-01T02:29:59', ..., '2005-12-31T21:30:00',
       '2005-12-31T22:29:59', '2005-12-31T23:29:59'],
      dtype='datetime64[s]')

Now plot timeseries of windspeed data

import pandas as pd
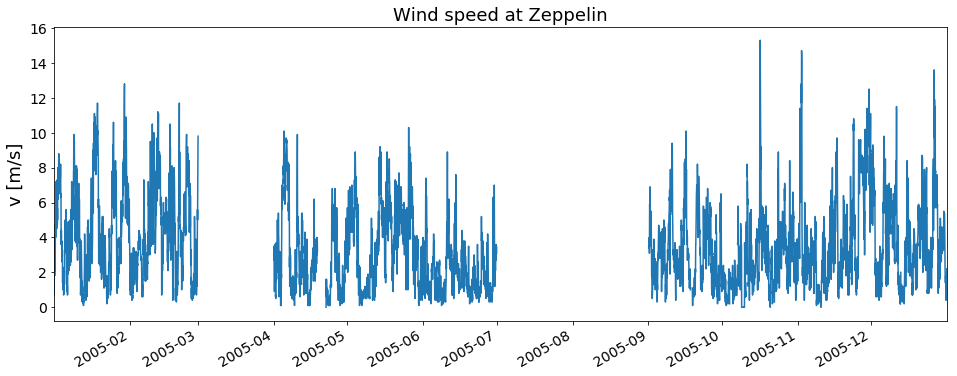
wind_tseries = pd.Series(wind_data, filedata.time_stamps)
ax = wind_tseries.plot(figsize=(16,6), title='Wind speed at Zeppelin');
ax.set_ylabel('v [{}]'.format(filedata.var_defs[COL_WINDSPEED].unit));