
Peer review matching timeline notebook
NeGI 2019 course in Abisko, Sweden. 21.10.2019, Paul Zieger
import random
import matplotlib.pyplot as plt
%matplotlib inline
import numpy as np
import time
from palettable.colorbrewer.sequential import Blues_8
ax.imshow(data, cmap=Blues_8.mpl_colormap)
negi_group=['Sigrid','Ingeborg','Goutam','Gabriel','Eemeli','Johanne',
            'Herman','Johannes','Jakob','Marit','Aiden','Bjørn',
            'Lasse','Stine','Sofie','Dina','Silje','Dominic','Tuuli',
            'Marek','Luis','Jonah','Johan','Franziska','Jolanta','Lance']
## Figure
with plt.xkcd():
    negi_group_dum=negi_group.copy()
    plt.figure(figsize=(9, 7))
    for i in range(0,len(negi_group)):
        name_dum=negi_group[i]
        while name_dum == negi_group[i]:
            name_dum=random.choice(negi_group_dum)
        negi_group_dum.remove(name_dum)
        plt.plot([1,3],[i,negi_group.index(name_dum)],'-o')
        plt.text(0.9,i,negi_group[i],horizontalalignment='right',
                 verticalalignment='center',color='black')
        plt.text(3.1,i,negi_group[i],horizontalalignment='left',
                 verticalalignment='center',color='black')
    plt.text(2,i+.5,'... WILL BE REVIEWED BY:',horizontalalignment='center',
             verticalalignment='center',color='black')
    plt.tick_params(axis='y', which='both', right=False,
                    left=False, labelleft=False)
    plt.tick_params(axis='x', which='both', bottom=False,
                    top=False, labelbottom=False)
    plt.xlim(0,4)
    plt.annotate(
        'THESE PEOPLE OVER HERE \n HAVE TO SEND THEIR REPORTS ...',
        xy=(0.95, -0.5), arrowprops=dict(arrowstyle='->'), xytext=(-0.2, -6))
    plt.annotate(
        '... TO THE PEOPLE \n ON THIS SIDE!',
        xy=(3, -0.5), arrowprops=dict(arrowstyle='->'), xytext=(3, -6))
    plt.annotate(
        'CHECK, BJØRN IS \n ON THE LIST!',
        xy=(0.6, 11.5), arrowprops=dict(arrowstyle='->'), xytext=(-1.1, 15))
    plt.annotate('NO. OF PARTICIPANTS: ' + str(len(negi_group)),
                 xy=(0.5, 12),  xytext=(3.5, -2.5))

    plt.tight_layout()
    plt.show()
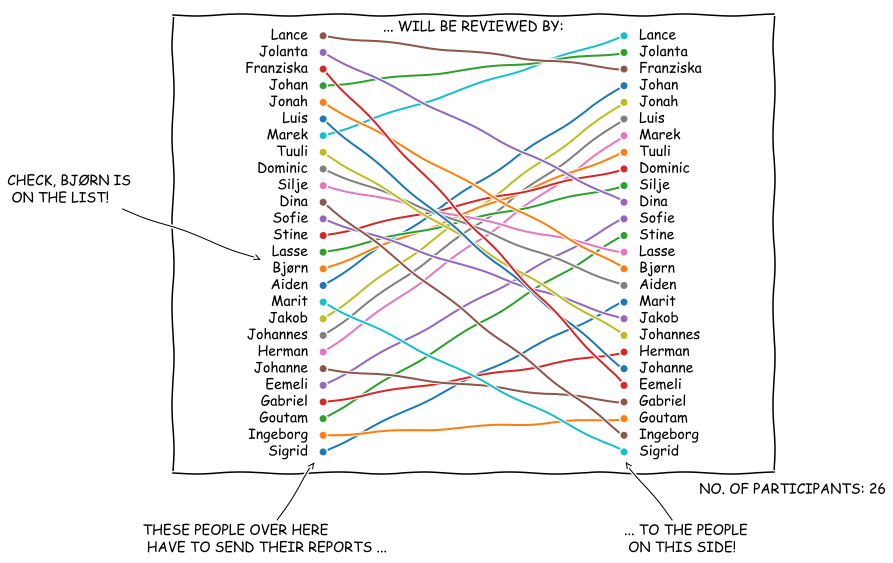
Figure 1: Result of randomly picked peer-review partners. Participants on the right hand side have to send their reports to the person on the left hand side.
## Figure
with plt.xkcd():
    fig = plt.figure(figsize=(12, 5))
    ax = fig.add_subplot(1, 1, 1)
    ax.spines['right'].set_color('none')
    ax.spines['top'].set_color('none')
    plt.xticks([])
    plt.yticks([])
    plt.plot([0.5,1,2,3,4,6,7],[1,1,2,2,2.5,2.5,2.5],'--',color='k')
    plt.plot([0.5,1,2,3,4,6],[1,1,2,2,2.5,2.5])
    plt.plot([2,3,4.5,4,6],[2,2,2.5,2.5,2.5],'o',color='k')
    plt.annotate(
        '1. NOV: SEND REPORT \nTO PEER-REVIEW',ha='center',
        xy=(2, 2), arrowprops=dict(arrowstyle='->'), xytext=(1.5, 2.5))
    plt.annotate(
        '5. NOV: RETURN \nOF FEEDBACK',ha='center',
        xy=(3, 2), arrowprops=dict(arrowstyle='->'), xytext=(2.5, 1.3))
    plt.annotate(
        '12. NOV: SUBMISSION OF \nFINAL VERSION, YEAH!',ha='center',
        xy=(4, 2.5), arrowprops=dict(arrowstyle='->'), xytext=(3.5, 3),
        color='darkorange')
    plt.annotate(
        '19. NOV: FEEDBACK FROM THE\nASSISTANTS (FOR OSLO STUDENTS)',ha='center',
        xy=(4.5, 2.5), arrowprops=dict(arrowstyle='->'), xytext=(4.5, 1.7))
    plt.annotate(
        '30. NOV: FEEDBACK FROM THE\nASSISTANTS (FOR ALL STUDENTS)',ha='center',
        xy=(6, 2.5), arrowprops=dict(arrowstyle='->'), xytext=(5.9, 2.8))
    plt.annotate(
        'EXTENSION FOR \n"BAD" REPORTS',ha='center',
        xy=(6.75, 2.5), arrowprops=dict(arrowstyle='->'), xytext=(6.95, 1.9))
    plt.xlabel('TIME')
    plt.ylim(0.9,3.5)
    plt.title('TIMELINE')
    plt.ylabel('REPORT QUALITY')
    plt.show()
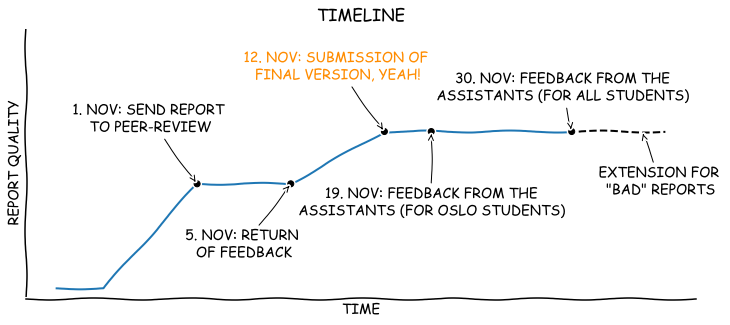
Figure 2: Timeline for the course report.
Some review feedback guidelines
- One paragraph with general comments (incl. scientific comments on results).
- What did I like?
- What would I do differently?
- What else would I look into?
- A list with specific comments (line-by--line)
- Mention things which are unclear
- Identify possible bugs
- Give tips for things which could be improved
- Further comments if you have any
- Keep it short and precise (~1 page)