Gridded model data dask rolling mean
# Modules

import xarray as xr
import matplotlib.pyplot as plt
import cartopy.crs as ccrs
from cartopy.util import add_cyclic_point
import numpy as np
import psyplot
import psyplot.project as psy
import os
import psutil
import pandas as pd
T_CHUNK = 200
chunks={
    'time' : T_CHUNK,
#     'lat'  : 10,
#     'lon'  : 10,
#     'lev'  : 10
}
# data
path1 = '~/shared-cmip6-for-ns1000k/historical/CESM2-WACCM/r1i1p1f1/'
filename1 = path1 + 'so2_AERmon_CESM2-WACCM_historical_r1i1p1f1_gn_185001-201412.nc'

DS1 = xr.open_dataset(filename1,chunks=chunks)
# _time = [t.strftime() for t in DS1['time'].values]
# _time = pd.to_datetime(_time)
# DS1['time'].values = _time
da = DS1['so2'].isel(lev=69)#[{'time':slice(None,None,100)}]
# da.load();
# da.isel(time=1970).plot()
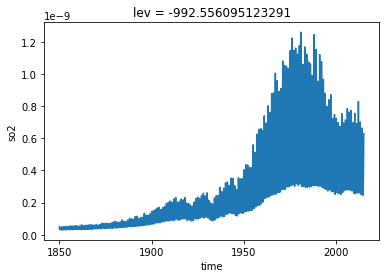
_dm = da
_dm = _dm.mean(['lat','lon'])
# _dm['time']
#we are loading into RAM (make sure you dont load massive datasets)
_dm.load()
_dm.plot()
#lets do a rooling mean
_dr = _dm.rolling({'time':100},
            min_periods=1,
            center=True
           )
_drm = _dr.mean()
_drm.load()
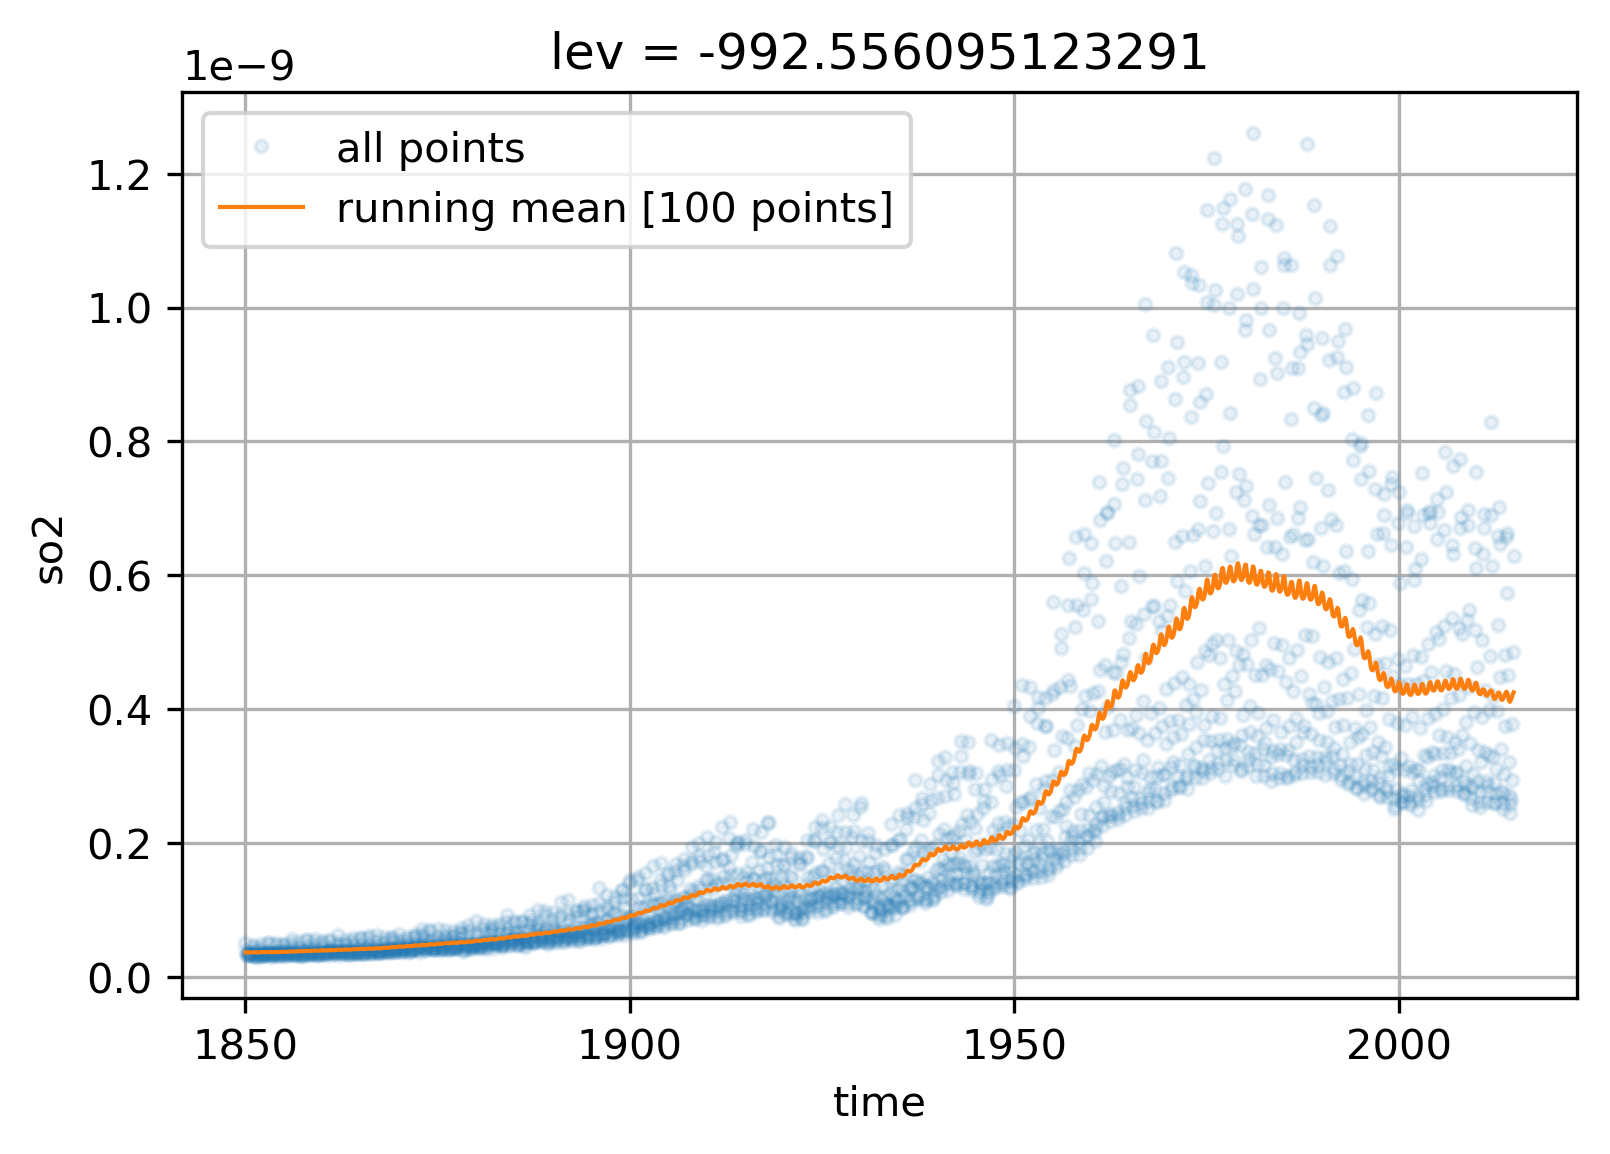
def custom_plot():
    ax = plt.axes()
    _dm.plot(ax=ax,
             marker='.',
             linewidth=0,
             label = 'all points',
             alpha=.1
            )
    _drm.plot(ax=ax,
             marker='',
             linewidth=1,
             label = 'running mean [100 points]'
            )
    ax.legend()
    ax.grid()
    ax.set_ylabel('so2')
custom_plot()

import matplotlib as mpl
mpl.rcParams['figure.dpi'] = 300
custom_plot()