Model evaluation using pyaerocom
After this introduction, you will know how to:
- Search for model and observation data in the provided database
- Read model and observation data
- Explore the data (
GriddedDataandUngriddedData) - Colocate data and assess model performance (
ColocatedData) - Convert from pyaerocom to other common libraries such as
pandasorxarray - Store intermediate results as NetCDF that may be used for further analysis.
import pyaerocom as pya
import matplotlib.pyplot as plt
from warnings import filterwarnings
filterwarnings('ignore')
pya.change_verbosity('critical', log=pya.const.print_log) # don't output warnings
pya.__version__
Please make sure to use version 0.8.1.dev2 (or later). If you have an earlier version, follow these instructions in order to update your installation.
import socket
if socket.gethostname() == 'pc4971':
    print('I am on Jonas PC')
    DATA_BASEDIR = '/home/jonasg/MyPyaerocom/pyaerocom-testdata'
else:
    print('I assume I am on the Abisko Jupyter hub')
    DATA_BASEDIR = '/home/notebook/shared-ns1000k/inputs/pyaerocom-testdata/'
pya.const.BASEDIR = DATA_BASEDIR
pya.const.BASEDIR
pya.browse_database('*TM5*')
You can use the Data ID or the Data directory to read this dataset (next step)
DATA_ID = 'TM5_AP3-CTRL2019'
reader = pya.io.ReadGridded(DATA_ID)
print(reader)
pya.get_variable('od550aer')
help(reader.read_var)
model_data = reader.read_var('od550aer', start=2010)
type(model_data)
model_data.ts_type # temporal resolution
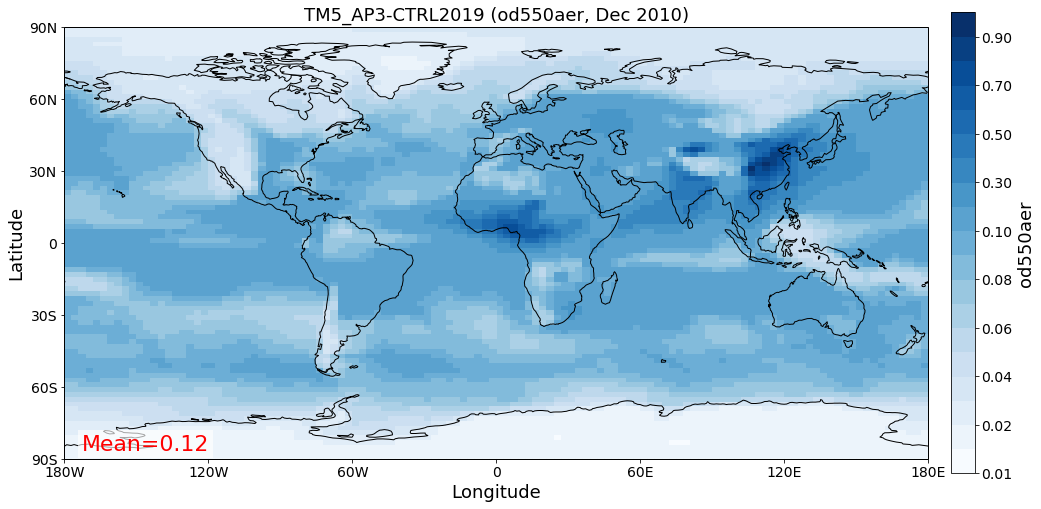
model_data.quickplot_map(11);
cube = model_data.cube
type(cube)
cube
try: # pyaerocom >= 0.8.1
    data_arr = model_data.to_xarray()
except: # pyaerocom < 0.8.1
    print('Coming soon in pyaerocom v0.8.1')
    import xarray as xarr
    data_arr = xarr.DataArray.from_iris(model_data.cube)
data_arr
- model_data.interpolate
- model_data.regrid
- model_data.crop
- model_data.resample_time
- model_data.sel
LON_ABISKO = 18.8312 #° E
LAT_ABISKO = 68.3495 #° N
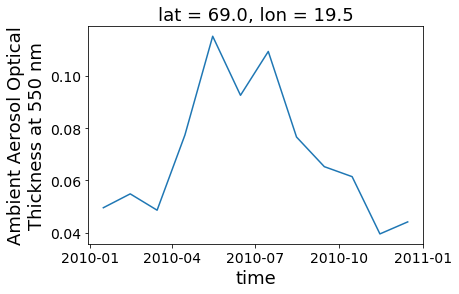
subset_abisko = model_data.sel(longitude=LON_ABISKO, latitude=LAT_ABISKO)
subset_abisko
try: # pyaerocom >= 0.8.1
    subset_abisko.to_xarray().plot();
except: # pyaerocom < 0.8.1
    print('Coming soon in pyaerocom v0.8.1')
    import xarray as xarr
    data_arr = xarr.DataArray.from_iris(subset_abisko.cube).plot()
- Ungridded data usually comprises timeseries data from different locations on earth and sampled at different times.
- The data is often provided per station in form of text files (e.g. CSV).
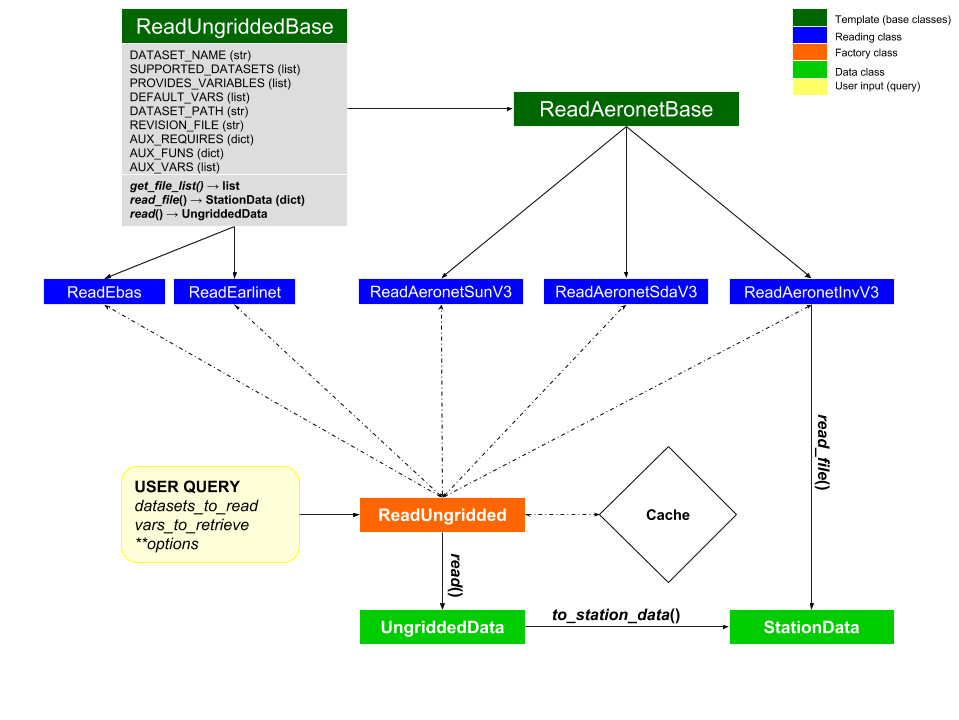
pya.browse_database('Aeronet*V3*Lev2*')
OBS_ID = 'AeronetSunV3Lev2.daily'
obs_reader = pya.io.ReadUngridded(OBS_ID)
print(obs_reader)
obs_data = obs_reader.read(vars_to_retrieve=['od550aer'])
obs_data
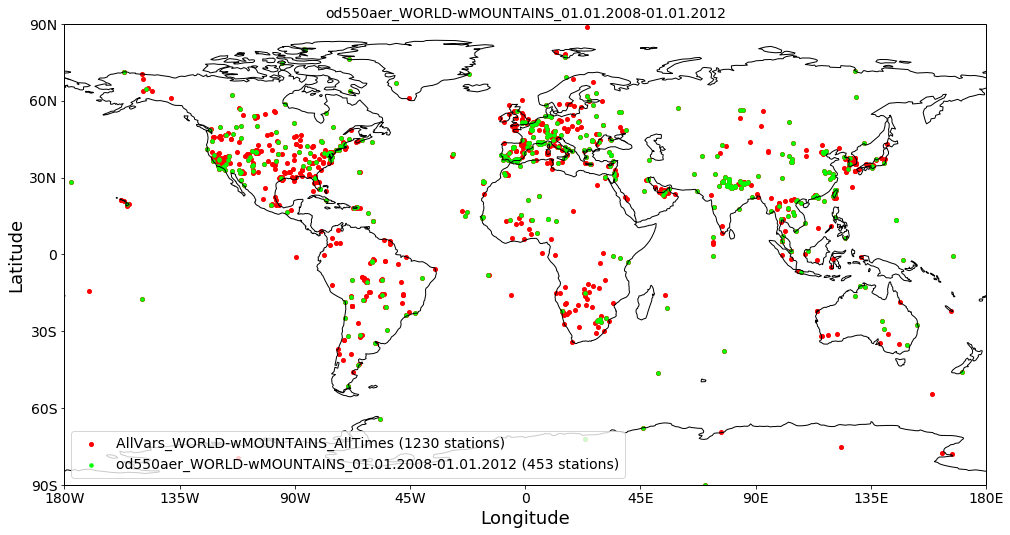
ax = obs_data.plot_station_coordinates(markersize=16)
ax = obs_data.plot_station_coordinates(var_name='od550aer',
                                       start=2008, stop=2012,
                                       markersize=12, color='lime', ax=ax)
len(obs_data.metadata)
e.g. metadata of first file:
obs_data.metadata[420]
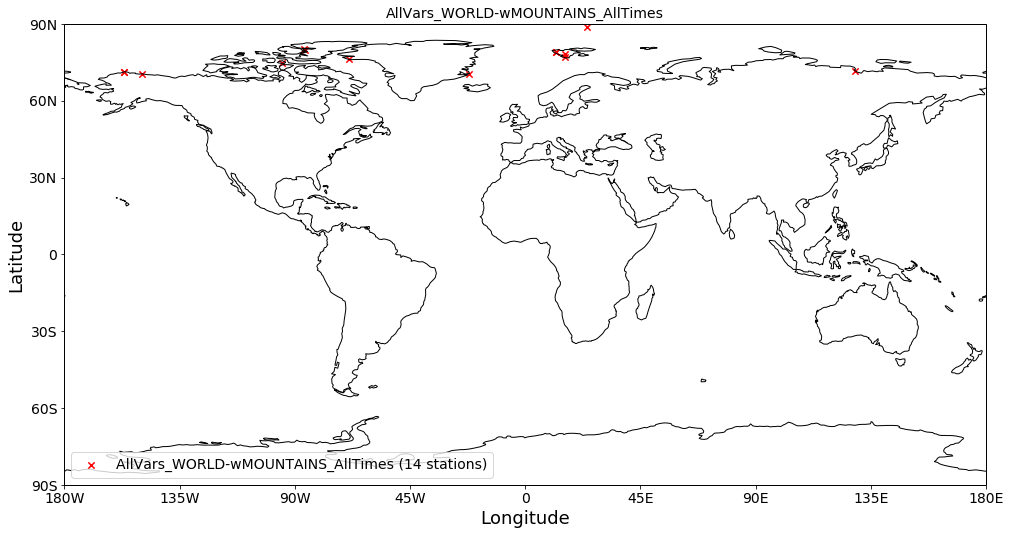
obs_arctic = obs_data.apply_filters(latitude=[70, 90])
obs_arctic.plot_station_coordinates(markersize=40, marker='x', color='r');
lille_data = obs_data.to_station_data('*Lille*')
type(lille_data)
lille_data.keys()
lille_data.longitude
lille_data['latitude']
lille_data.od550aer # THIS is exactly equivalent to the command lille_data['od550aer']
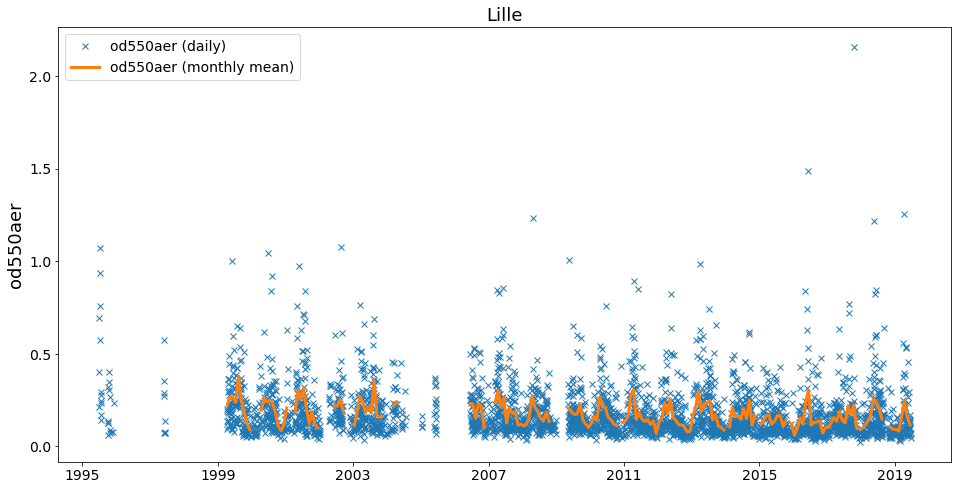
ax = lille_data.plot_timeseries(var_name='od550aer', marker='x', linestyle='none')
ax = lille_data.plot_timeseries(var_name='od550aer', ts_type='monthly', linestyle='-', lw=3, ax=ax)
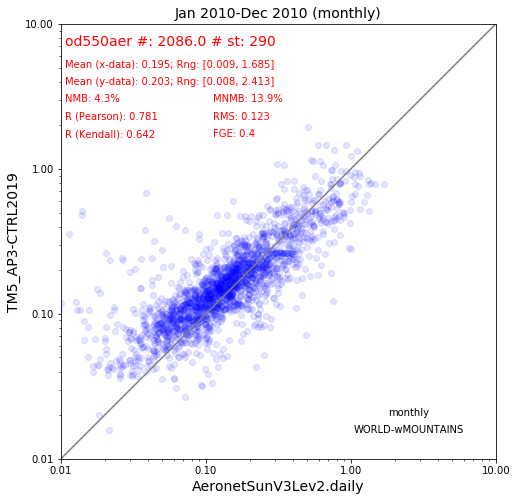
col_data = pya.colocation.colocate_gridded_ungridded(model_data,
                                                     obs_data,
                                                     ts_type='monthly',
                                                     start=2010)
help(pya.colocation.colocate_gridded_gridded)
type(col_data)
col_data.plot_scatter(marker='o', color='blue', alpha=0.1);
col_data.data
col_data.savename_aerocom
col_data.to_netcdf('.')
High level colocation and creation of colocated NetCDF files
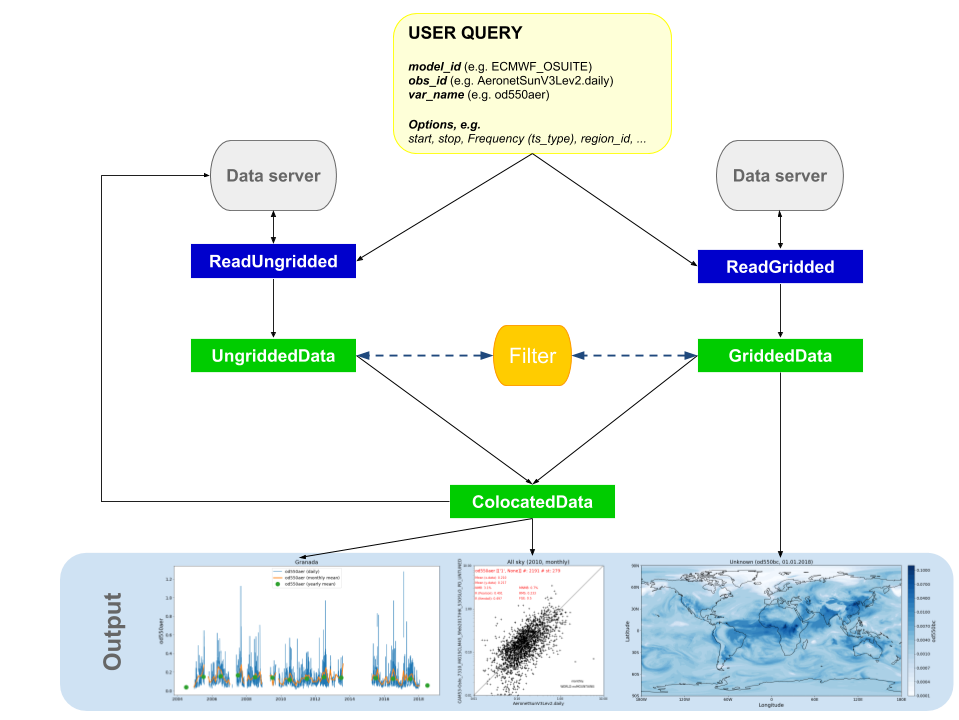
The example above did essentially the following steps:
- Find a model and variable of interest
- Find a corresponding observation network that measures that variable
- Load both model and obsdata for this variable into
GriddedDataandUngriddedData, respectively - Colocate the model to the observation locations and create
ColocatedDataobject - Save the colocated data object as NetCDF file
All these steps can be done with a one-liner in pyaerocom using the Colocator class
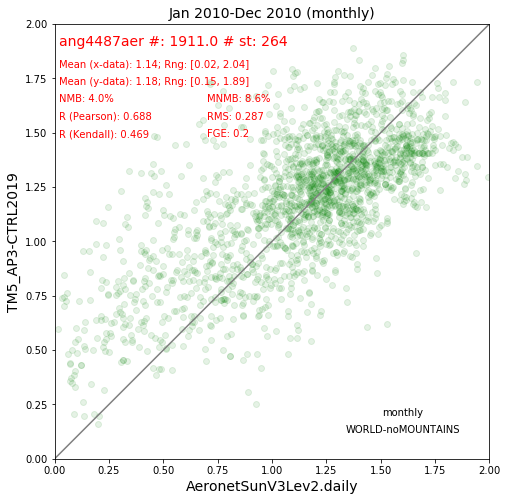
Colocate the same model and observation network but now use the Angstrom exponent (ang4487aer) instead of the AOD:
colocator = pya.Colocator(model_id=DATA_ID,
                          obs_id=OBS_ID,
                          obs_vars='ang4487aer',
                          ts_type='monthly',
                          start=2010,
                          basedir_coldata='.',
                          reanalyse_existing=True,
                          save_coldata=True)
colocator.run()
The Colocator objects stores all ColocatedData objects that were created in it's data attribute, which is a nested dictionary, organised via model_id and var_name:
colocator.data['TM5_AP3-CTRL2019']['ang4487aer']
colocator.data[DATA_ID]['ang4487aer'].plot_scatter(marker='o', alpha=0.1, color='g');
pya.browse_database('*CAM*')
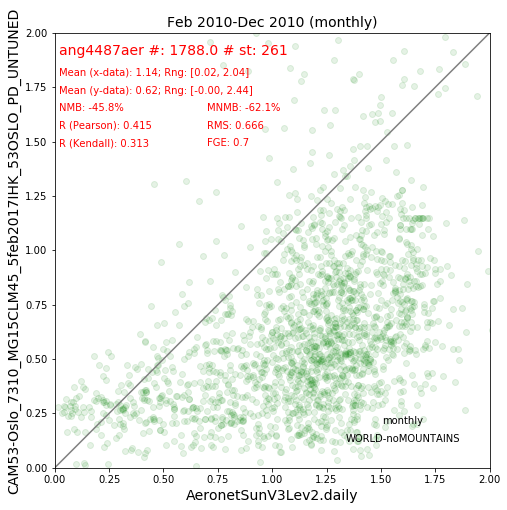
ANOTHER_MODEL_ID = 'CAM53-Oslo_7310_MG15CLM45_5feb2017IHK_53OSLO_PD_UNTUNED'
colocator.run(model_id=ANOTHER_MODEL_ID)
colocator.data.keys()
colocator.data[ANOTHER_MODEL_ID]['ang4487aer'].plot_scatter(marker='o', alpha=0.1, color='g');
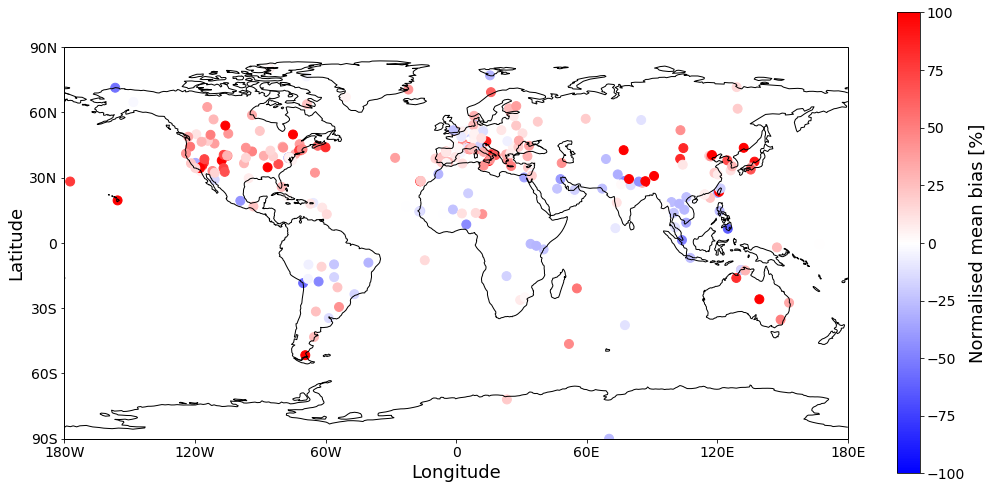
_arr = col_data.data
mean_bias = ((_arr[1] - _arr[0])/_arr[0]).mean('time') * 100 #%
mean_bias
ax = pya.plot.mapping.init_map()
ax = pya.plot.mapping.init_map()
_sc = ax.scatter(mean_bias.longitude, mean_bias.latitude, marker='o', c=mean_bias.data,
                 cmap='bwr',
                 vmin=-100, vmax=100, s=80)
cb = plt.colorbar(_sc)
cb.ax.set_ylabel('Normalised mean bias [%]');
Now if you colocate a lot of models against multiple different observations, you might end up here:
https://aerocom-evaluation.met.no/overall.php?project=aerocom&exp=PIII-optics2019

