Tuulivarenka project
import numpy as np
import xarray as xr
import matplotlib.pyplot as plt
import pandas as pd
import seaborn as sns
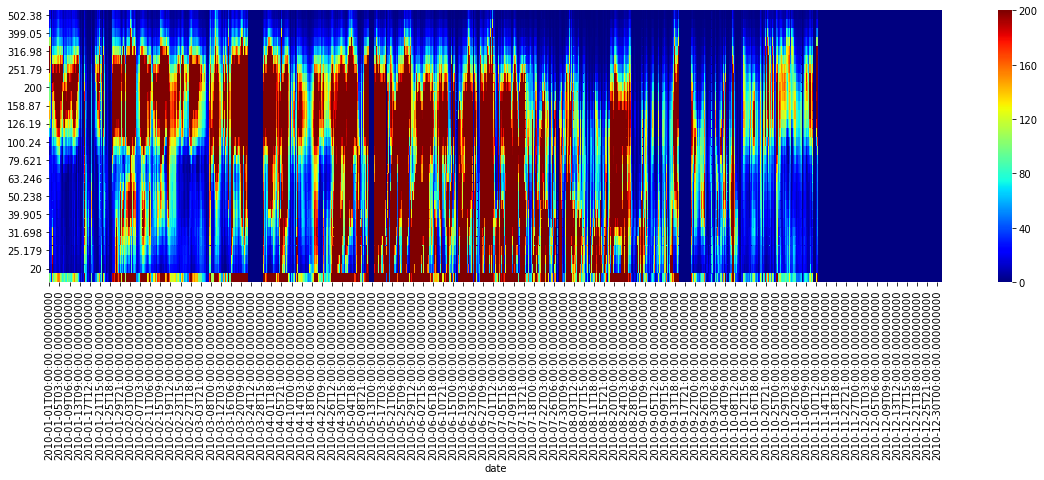
Opening Zeppelin hourly data from 2010
filenam1 = '/home/2daa7756-2d5725-2d4dfb-2db0ff-2d5e0a6858a009/shared-ns1000k/inputs//Aerosol_sizedist_obs/Zeppelin_2010_hourly.csv'
filenam2 = '/home/2daa7756-2d5725-2d4dfb-2db0ff-2d5e0a6858a009/shared-ns1000k/inputs//Aerosol_sizedist_obs/Zeppelin_2011_hourly.csv'
flist=[filenam1, filenam2]
ldf = []
for f in flist:
    ldf.append(pd.read_csv(f, parse_dates=[['0','0.1','0.2','0.3','0.4']],date_parser = mydateparser))
data = pd.concat(ldf, axis=0)
mydateparser = lambda x: pd.datetime.strptime(x, "%Y %m %d %H %M")
data = pd.read_csv(filenam, parse_dates=[['0','0.1','0.2','0.3','0.4']],date_parser = mydateparser)
#data.head()
#data.info()
data.rename(columns={'0_0.1_0.2_0.3_0.4':'date'}, inplace = True)
data = data.set_index('date')
 #remove last column
 data.drop(labels='0.6', axis=1, inplace=True)
fig = plt.figure(1, figsize=[20,5])

#set projection for plotting

ax = plt.subplot(1,1,1)
sns.heatmap(data.T.iloc[::-1], vmin=0, vmax=200, cmap='jet')
data.iloc[:,1]
#Vaihdetaan oikeesta datasta kaikki -999 arvot NaN
data = data.replace(-999,np.nan)
data
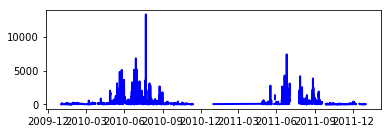
#valitaan datasta pelkästään tietyt kolumnit (20-50nm) ja summataan ne yhteen
small_particle_data = data.iloc[:,1:9].sum(axis=1)
# take the mean for every row for indexes between 1-9 so (20-50 nm)
small_particle_data_mean = data.iloc[:,1:9].mean(axis=1)
#plot the data
fig = plt.figure()
ax = fig.add_subplot(2, 1, 1)

line, = ax.plot(small_particle_data_mean, color='blue', lw=2)

# change the y-axes to log
#ax.set_yscale('log')
small_particle_data_mean
# lets take mean for every month and plot them together
small_particle_data_mean.resample('M').mean().plot()
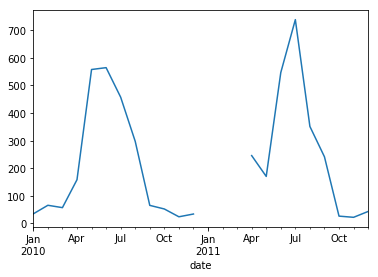
_se = small_particle_data_mean.resample('M').mean()
Y = 'y'
M = 'm'
var = 'spdm'
_df = pd.DataFrame(_se,columns=[var])
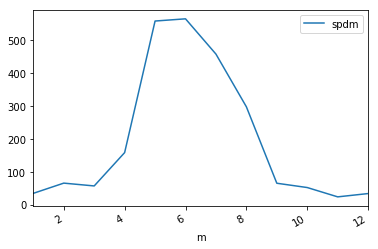
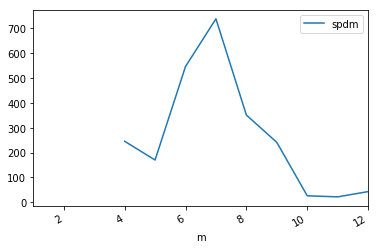
_df[M] = _df.index.month
_df[Y] = _df.index.year
_df= _df.set_index(M)
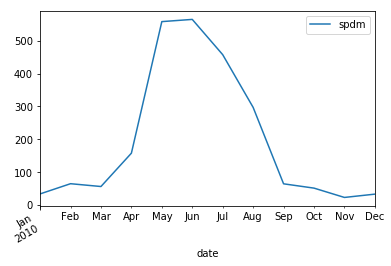
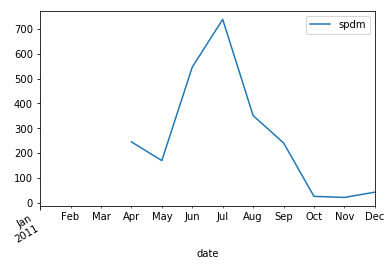
_df.groupby('y').plot(y='spdm',subplots=True)
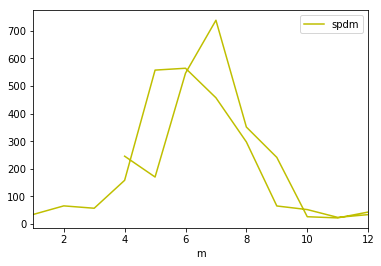
_df.plot(y='spdm',color='y')
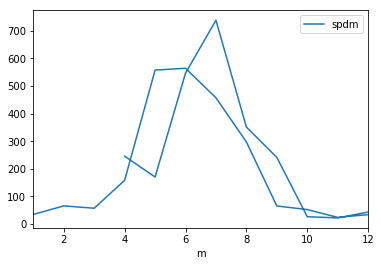
_df.plot(y='spdm',x='m')
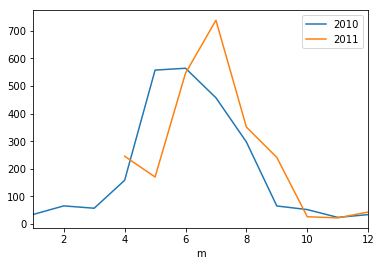
ax = plt.axes()
_df[_df['y']==2010].plot(x='m',y='spdm',ax=ax, label ='2010' )
_df[_df['y']==2011].plot(x='m',y='spdm',ax=ax, label ='2011')
_df.reset_index()
_df1 = _df.reset_index()
_df2=_df1.set_index(['m','y']).unstack('y')
_gr.plot(y='spdm',subplots=True)