Regridding model data with xESMF
Contents
Regridding model data with xESMF
Import python packages
# supress warnings
import warnings
warnings.filterwarnings('ignore') # don't output warnings

import os
# import packages
import xarray as xr
xr.set_options(display_style='html')
import intake
import cftime
import cartopy.crs as ccrs
import matplotlib.pyplot as plt
import matplotlib.path as mpath
import numpy as np
import xesmf as xe
from cmcrameri import cm

%matplotlib inline
Open CMIP6 online catalog
cat_url = "https://storage.googleapis.com/cmip6/pangeo-cmip6.json"
col = intake.open_esm_datastore(cat_url)
col
pangeo-cmip6 catalog with 7619 dataset(s) from 517624 asset(s):
| unique | |
|---|---|
| activity_id | 18 |
| institution_id | 36 |
| source_id | 88 |
| experiment_id | 170 |
| member_id | 657 |
| table_id | 37 |
| variable_id | 709 |
| grid_label | 10 |
| zstore | 517624 |
| dcpp_init_year | 60 |
| version | 710 |
Get data in xarray
Search od550aer variable dataset
cat = col.search(experiment_id=['historical'], variable_id='od550aer', member_id=['r1i1p1f1'], grid_label='gn')
cat.df
| activity_id | institution_id | source_id | experiment_id | member_id | table_id | variable_id | grid_label | zstore | dcpp_init_year | version | |
|---|---|---|---|---|---|---|---|---|---|---|---|
| 0 | CMIP | NCAR | CESM2-WACCM | historical | r1i1p1f1 | AERmon | od550aer | gn | gs://cmip6/CMIP6/CMIP/NCAR/CESM2-WACCM/histori... | NaN | 20190227 |
| 1 | CMIP | NCAR | CESM2 | historical | r1i1p1f1 | AERmon | od550aer | gn | gs://cmip6/CMIP6/CMIP/NCAR/CESM2/historical/r1... | NaN | 20190308 |
| 2 | CMIP | CCCma | CanESM5 | historical | r1i1p1f1 | AERmon | od550aer | gn | gs://cmip6/CMIP6/CMIP/CCCma/CanESM5/historical... | NaN | 20190429 |
| 3 | CMIP | HAMMOZ-Consortium | MPI-ESM-1-2-HAM | historical | r1i1p1f1 | AERmon | od550aer | gn | gs://cmip6/CMIP6/CMIP/HAMMOZ-Consortium/MPI-ES... | NaN | 20190627 |
| 4 | CMIP | MPI-M | MPI-ESM1-2-HR | historical | r1i1p1f1 | AERmon | od550aer | gn | gs://cmip6/CMIP6/CMIP/MPI-M/MPI-ESM1-2-HR/hist... | NaN | 20190710 |
| 5 | CMIP | MPI-M | MPI-ESM1-2-LR | historical | r1i1p1f1 | AERmon | od550aer | gn | gs://cmip6/CMIP6/CMIP/MPI-M/MPI-ESM1-2-LR/hist... | NaN | 20190710 |
| 6 | CMIP | NCC | NorESM2-LM | historical | r1i1p1f1 | AERmon | od550aer | gn | gs://cmip6/CMIP6/CMIP/NCC/NorESM2-LM/historica... | NaN | 20190815 |
| 7 | CMIP | BCC | BCC-ESM1 | historical | r1i1p1f1 | AERmon | od550aer | gn | gs://cmip6/CMIP6/CMIP/BCC/BCC-ESM1/historical/... | NaN | 20190918 |
| 8 | CMIP | NCAR | CESM2-WACCM-FV2 | historical | r1i1p1f1 | AERmon | od550aer | gn | gs://cmip6/CMIP6/CMIP/NCAR/CESM2-WACCM-FV2/his... | NaN | 20191120 |
| 9 | CMIP | NCAR | CESM2-FV2 | historical | r1i1p1f1 | AERmon | od550aer | gn | gs://cmip6/CMIP6/CMIP/NCAR/CESM2-FV2/historica... | NaN | 20191120 |
| 10 | CMIP | MRI | MRI-ESM2-0 | historical | r1i1p1f1 | AERmon | od550aer | gn | gs://cmip6/CMIP6/CMIP/MRI/MRI-ESM2-0/historica... | NaN | 20200207 |
cat.df['source_id'].unique()
array(['CESM2-WACCM', 'CESM2', 'CanESM5', 'MPI-ESM-1-2-HAM',
       'MPI-ESM1-2-HR', 'MPI-ESM1-2-LR', 'NorESM2-LM', 'BCC-ESM1',
       'CESM2-WACCM-FV2', 'CESM2-FV2', 'MRI-ESM2-0'], dtype=object)
Create dictionary from the list of datasets we found
This step may take several minutes so be patient!
dset_dict = cat.to_dataset_dict(zarr_kwargs={'use_cftime':True})
--> The keys in the returned dictionary of datasets are constructed as follows:
	'activity_id.institution_id.source_id.experiment_id.table_id.grid_label'
100.00% [11/11 01:42<00:00]
list(dset_dict.keys())
['CMIP.MPI-M.MPI-ESM1-2-LR.historical.AERmon.gn',
 'CMIP.BCC.BCC-ESM1.historical.AERmon.gn',
 'CMIP.NCAR.CESM2-WACCM.historical.AERmon.gn',
 'CMIP.MPI-M.MPI-ESM1-2-HR.historical.AERmon.gn',
 'CMIP.MRI.MRI-ESM2-0.historical.AERmon.gn',
 'CMIP.CCCma.CanESM5.historical.AERmon.gn',
 'CMIP.NCAR.CESM2.historical.AERmon.gn',
 'CMIP.NCC.NorESM2-LM.historical.AERmon.gn',
 'CMIP.HAMMOZ-Consortium.MPI-ESM-1-2-HAM.historical.AERmon.gn',
 'CMIP.NCAR.CESM2-WACCM-FV2.historical.AERmon.gn',
 'CMIP.NCAR.CESM2-FV2.historical.AERmon.gn']
Select model and visualize a single date
Use data as xarray to make a simple plot
ds = dset_dict['CMIP.NCC.NorESM2-LM.historical.AERmon.gn']
ds
<xarray.Dataset>
Dimensions:     (bnds: 2, lat: 96, lon: 144, member_id: 1, time: 1980)
Coordinates:
  * lat         (lat) float64 -90.0 -88.11 -86.21 -84.32 ... 86.21 88.11 90.0
    lat_bnds    (lat, bnds) float64 dask.array<chunksize=(96, 2), meta=np.ndarray>
  * lon         (lon) float64 0.0 2.5 5.0 7.5 10.0 ... 350.0 352.5 355.0 357.5
    lon_bnds    (lon, bnds) float64 dask.array<chunksize=(144, 2), meta=np.ndarray>
  * time        (time) object 1850-01-16 12:00:00 ... 2014-12-16 12:00:00
    time_bnds   (time, bnds) object dask.array<chunksize=(1980, 2), meta=np.ndarray>
    wavelength  float64 ...
  * member_id   (member_id) <U8 'r1i1p1f1'
Dimensions without coordinates: bnds
Data variables:
    od550aer    (member_id, time, lat, lon) float32 dask.array<chunksize=(1, 990, 96, 144), meta=np.ndarray>
Attributes: (12/52)
    Conventions:               CF-1.7 CMIP-6.2
    activity_id:               CMIP
    branch_method:             Hybrid-restart from year 1600-01-01 of piControl
    branch_time:               0.0
    branch_time_in_child:      0.0
    branch_time_in_parent:     430335.0
    ...                        ...
    title:                     NorESM2-LM output prepared for CMIP6
    tracking_id:               hdl:21.14100/efd7a56e-94a8-47f5-b3d8-06ae02268...
    variable_id:               od550aer
    variant_label:             r1i1p1f1
    intake_esm_varname:        ['od550aer']
    intake_esm_dataset_key:    CMIP.NCC.NorESM2-LM.historical.AERmon.gn
xarray.Dataset
- bnds: 2
- lat: 96
- lon: 144
- member_id: 1
- time: 1980
- lat(lat)float64-90.0 -88.11 -86.21 ... 88.11 90.0
- axis :
- Y
- bounds :
- lat_bnds
- long_name :
- Latitude
- standard_name :
- latitude
- units :
- degrees_north
array([-90. , -88.105263, -86.210526, -84.315789, -82.421053, -80.526316, -78.631579, -76.736842, -74.842105, -72.947368, -71.052632, -69.157895, -67.263158, -65.368421, -63.473684, -61.578947, -59.684211, -57.789474, -55.894737, -54. , -52.105263, -50.210526, -48.315789, -46.421053, -44.526316, -42.631579, -40.736842, -38.842105, -36.947368, -35.052632, -33.157895, -31.263158, -29.368421, -27.473684, -25.578947, -23.684211, -21.789474, -19.894737, -18. , -16.105263, -14.210526, -12.315789, -10.421053, -8.526316, -6.631579, -4.736842, -2.842105, -0.947368, 0.947368, 2.842105, 4.736842, 6.631579, 8.526316, 10.421053, 12.315789, 14.210526, 16.105263, 18. , 19.894737, 21.789474, 23.684211, 25.578947, 27.473684, 29.368421, 31.263158, 33.157895, 35.052632, 36.947368, 38.842105, 40.736842, 42.631579, 44.526316, 46.421053, 48.315789, 50.210526, 52.105263, 54. , 55.894737, 57.789474, 59.684211, 61.578947, 63.473684, 65.368421, 67.263158, 69.157895, 71.052632, 72.947368, 74.842105, 76.736842, 78.631579, 80.526316, 82.421053, 84.315789, 86.210526, 88.105263, 90. ]) - lat_bnds(lat, bnds)float64dask.array<chunksize=(96, 2), meta=np.ndarray>
Array Chunk Bytes 1.54 kB 1.54 kB Shape (96, 2) (96, 2) Count 2 Tasks 1 Chunks Type float64 numpy.ndarray - lon(lon)float640.0 2.5 5.0 ... 352.5 355.0 357.5
- axis :
- X
- bounds :
- lon_bnds
- long_name :
- Longitude
- standard_name :
- longitude
- units :
- degrees_east
array([ 0. , 2.5, 5. , 7.5, 10. , 12.5, 15. , 17.5, 20. , 22.5, 25. , 27.5, 30. , 32.5, 35. , 37.5, 40. , 42.5, 45. , 47.5, 50. , 52.5, 55. , 57.5, 60. , 62.5, 65. , 67.5, 70. , 72.5, 75. , 77.5, 80. , 82.5, 85. , 87.5, 90. , 92.5, 95. , 97.5, 100. , 102.5, 105. , 107.5, 110. , 112.5, 115. , 117.5, 120. , 122.5, 125. , 127.5, 130. , 132.5, 135. , 137.5, 140. , 142.5, 145. , 147.5, 150. , 152.5, 155. , 157.5, 160. , 162.5, 165. , 167.5, 170. , 172.5, 175. , 177.5, 180. , 182.5, 185. , 187.5, 190. , 192.5, 195. , 197.5, 200. , 202.5, 205. , 207.5, 210. , 212.5, 215. , 217.5, 220. , 222.5, 225. , 227.5, 230. , 232.5, 235. , 237.5, 240. , 242.5, 245. , 247.5, 250. , 252.5, 255. , 257.5, 260. , 262.5, 265. , 267.5, 270. , 272.5, 275. , 277.5, 280. , 282.5, 285. , 287.5, 290. , 292.5, 295. , 297.5, 300. , 302.5, 305. , 307.5, 310. , 312.5, 315. , 317.5, 320. , 322.5, 325. , 327.5, 330. , 332.5, 335. , 337.5, 340. , 342.5, 345. , 347.5, 350. , 352.5, 355. , 357.5]) - lon_bnds(lon, bnds)float64dask.array<chunksize=(144, 2), meta=np.ndarray>
Array Chunk Bytes 2.30 kB 2.30 kB Shape (144, 2) (144, 2) Count 2 Tasks 1 Chunks Type float64 numpy.ndarray - time(time)object1850-01-16 12:00:00 ... 2014-12-...
- axis :
- T
- bounds :
- time_bnds
- long_name :
- time
- standard_name :
- time
array([cftime.DatetimeNoLeap(1850, 1, 16, 12, 0, 0, 0), cftime.DatetimeNoLeap(1850, 2, 15, 0, 0, 0, 0), cftime.DatetimeNoLeap(1850, 3, 16, 12, 0, 0, 0), ..., cftime.DatetimeNoLeap(2014, 10, 16, 12, 0, 0, 0), cftime.DatetimeNoLeap(2014, 11, 16, 0, 0, 0, 0), cftime.DatetimeNoLeap(2014, 12, 16, 12, 0, 0, 0)], dtype=object) - time_bnds(time, bnds)objectdask.array<chunksize=(1980, 2), meta=np.ndarray>
Array Chunk Bytes 31.68 kB 31.68 kB Shape (1980, 2) (1980, 2) Count 2 Tasks 1 Chunks Type object numpy.ndarray - wavelength()float64...
- long_name :
- Radiation Wavelength 550 nanometers
- standard_name :
- radiation_wavelength
- units :
- nm
array(550.)
- member_id(member_id)<U8'r1i1p1f1'
array(['r1i1p1f1'], dtype='<U8')
- od550aer(member_id, time, lat, lon)float32dask.array<chunksize=(1, 990, 96, 144), meta=np.ndarray>
- cell_measures :
- area: areacella
- cell_methods :
- area: time: mean
- comment :
- AOD from the ambient aerosols (i.e., includes aerosol water). Does not include AOD from stratospheric aerosols if these are prescribed but includes other possible background aerosol types. Needs a comment attribute 'wavelength: 550nm'
- history :
- 2019-08-15T14:30:44Z altered by CMOR: Treated scalar dimension: 'wavelength'. 2019-08-15T14:30:45Z altered by CMOR: Converted type from 'd' to 'f'.
- long_name :
- Ambient Aerosol Optical Thickness at 550nm
- original_name :
- DOD550
- standard_name :
- atmosphere_optical_thickness_due_to_ambient_aerosol_particles
- units :
- 1
Array Chunk Bytes 109.49 MB 54.74 MB Shape (1, 1980, 96, 144) (1, 990, 96, 144) Count 5 Tasks 2 Chunks Type float32 numpy.ndarray
- Conventions :
- CF-1.7 CMIP-6.2
- activity_id :
- CMIP
- branch_method :
- Hybrid-restart from year 1600-01-01 of piControl
- branch_time :
- 0.0
- branch_time_in_child :
- 0.0
- branch_time_in_parent :
- 430335.0
- cmor_version :
- 3.5.0
- contact :
- Please send any requests or bug reports to noresm-ncc@met.no.
- creation_date :
- 2019-08-15T14:30:45Z
- data_specs_version :
- 01.00.31
- experiment :
- all-forcing simulation of the recent past
- experiment_id :
- historical
- external_variables :
- areacella
- forcing_index :
- 1
- frequency :
- mon
- further_info_url :
- https://furtherinfo.es-doc.org/CMIP6.NCC.NorESM2-LM.historical.none.r1i1p1f1
- grid :
- finite-volume grid with 1.9x2.5 degree lat/lon resolution
- grid_label :
- gn
- history :
- 2019-08-15T14:30:45Z ; CMOR rewrote data to be consistent with CMIP6, CF-1.7 CMIP-6.2 and CF standards.
- initialization_index :
- 1
- institution :
- NorESM Climate modeling Consortium consisting of CICERO (Center for International Climate and Environmental Research, Oslo 0349), MET-Norway (Norwegian Meteorological Institute, Oslo 0313), NERSC (Nansen Environmental and Remote Sensing Center, Bergen 5006), NILU (Norwegian Institute for Air Research, Kjeller 2027), UiB (University of Bergen, Bergen 5007), UiO (University of Oslo, Oslo 0313) and UNI (Uni Research, Bergen 5008), Norway. Mailing address: NCC, c/o MET-Norway, Henrik Mohns plass 1, Oslo 0313, Norway
- institution_id :
- NCC
- license :
- CMIP6 model data produced by NCC is licensed under a Creative Commons Attribution ShareAlike 4.0 International License (https://creativecommons.org/licenses). Consult https://pcmdi.llnl.gov/CMIP6/TermsOfUse for terms of use governing CMIP6 output, including citation requirements and proper acknowledgment. Further information about this data, including some limitations, can be found via the further_info_url (recorded as a global attribute in this file) and at https:///pcmdi.llnl.gov/. The data producers and data providers make no warranty, either express or implied, including, but not limited to, warranties of merchantability and fitness for a particular purpose. All liabilities arising from the supply of the information (including any liability arising in negligence) are excluded to the fullest extent permitted by law.
- mip_era :
- CMIP6
- model_id :
- NorESM2-LM
- nominal_resolution :
- 250 km
- parent_activity_id :
- CMIP
- parent_experiment_id :
- piControl
- parent_mip_era :
- CMIP6
- parent_source_id :
- NorESM2-LM
- parent_sub_experiment_id :
- none
- parent_time_units :
- days since 0421-01-01
- parent_variant_label :
- r1i1p1f1
- physics_index :
- 1
- product :
- model-output
- realization_index :
- 1
- realm :
- aerosol
- run_variant :
- N/A
- source :
- NorESM2-LM (2017): aerosol: OsloAero atmos: CAM-OSLO (2 degree resolution; 144 x 96; 32 levels; top level 3 mb) atmosChem: OsloChemSimp land: CLM landIce: CISM ocean: MICOM (1 degree resolution; 360 x 384; 70 levels; top grid cell minimum 0-2.5 m [native model uses hybrid density and generic upper-layer coordinate interpolated to z-level for contributed data]) ocnBgchem: HAMOCC seaIce: CICE
- source_id :
- NorESM2-LM
- source_type :
- AOGCM
- status :
- 2020-03-25;created; by gcs.cmip6.ldeo@gmail.com
- sub_experiment :
- none
- sub_experiment_id :
- none
- table_id :
- AERmon
- table_info :
- Creation Date:(24 July 2019) MD5:08e314340b9dd440c36c1b8e484514f4
- title :
- NorESM2-LM output prepared for CMIP6
- tracking_id :
- hdl:21.14100/efd7a56e-94a8-47f5-b3d8-06ae02268192 hdl:21.14100/0c3683e7-1c3f-45d6-bbc7-414f68e7a801 hdl:21.14100/a83a3a96-0d16-4f3e-aa88-a68f00e1ce2e hdl:21.14100/7a629db0-dda1-445d-a496-2e77c9c7c20a hdl:21.14100/388888f8-7ee4-467f-aca9-8a6e45361f55 hdl:21.14100/7aa3797a-b0e7-427d-a209-efed00cd1724 hdl:21.14100/33d3ae45-cb42-47e5-8c08-76df86d298a8 hdl:21.14100/10f9c9e3-3d54-494a-b153-ea63c5b584c7 hdl:21.14100/2a3a1f67-8890-4e89-b6de-84b2b13cf70e hdl:21.14100/447d4151-8161-461a-a66e-f21144baabf6 hdl:21.14100/c1bd13af-f8b2-4b18-bd2c-34b13a4921dc hdl:21.14100/eee79e49-dd70-4d8f-b195-c885aca26e3a hdl:21.14100/7cd2e526-a94c-4004-bfe8-32832a9df6d7 hdl:21.14100/b2421ba2-c8c9-44c0-84af-f9b09cb87759 hdl:21.14100/f87b3cf5-e68d-40f2-a289-667b4cf7d15f hdl:21.14100/a6542f1a-0567-4e7a-b063-f5609f017d69 hdl:21.14100/01e4e8d6-b84e-4d25-9f50-4a9ea5588f07
- variable_id :
- od550aer
- variant_label :
- r1i1p1f1
- intake_esm_varname :
- ['od550aer']
- intake_esm_dataset_key :
- CMIP.NCC.NorESM2-LM.historical.AERmon.gn
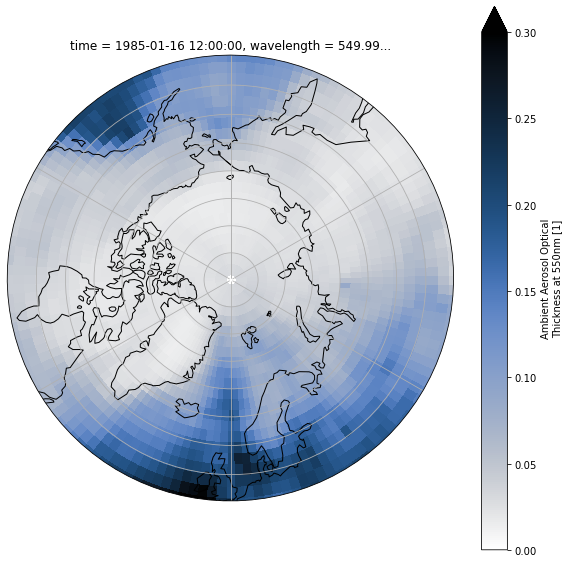
Plot on NorthPolarStereo and set the latitude limit
def polarCentral_set_latlim(lat_lims, ax):
    ax.set_extent([-180, 180, lat_lims[0], lat_lims[1]], ccrs.PlateCarree())
    # Compute a circle in axes coordinates, which we can use as a boundary
    # for the map. We can pan/zoom as much as we like - the boundary will be
    # permanently circular.
    theta = np.linspace(0, 2*np.pi, 100)
    center, radius = [0.5, 0.5], 0.5
    verts = np.vstack([np.sin(theta), np.cos(theta)]).T
    circle = mpath.Path(verts * radius + center)

    ax.set_boundary(circle, transform=ax.transAxes)
fig = plt.figure(1, figsize=[10,10])

# Fix extent
minval = 0
maxval = 0.3

ax = plt.subplot(1, 1, 1, projection=ccrs.NorthPolarStereo())
ax.coastlines()
ax.gridlines()
polarCentral_set_latlim([50,90], ax)
ds['od550aer'].sel(time=cftime.DatetimeNoLeap(1985, 1, 16, 12, 0, 0, 0)).plot(ax=ax, vmin=minval, vmax=maxval, transform=ccrs.PlateCarree(), cmap=cm.oslo_r)
<matplotlib.collections.QuadMesh at 0x7fbfbc1aec70>
Get attributes (unique identifier)
ds.attrs['tracking_id']
'hdl:21.14100/efd7a56e-94a8-47f5-b3d8-06ae02268192\nhdl:21.14100/0c3683e7-1c3f-45d6-bbc7-414f68e7a801\nhdl:21.14100/a83a3a96-0d16-4f3e-aa88-a68f00e1ce2e\nhdl:21.14100/7a629db0-dda1-445d-a496-2e77c9c7c20a\nhdl:21.14100/388888f8-7ee4-467f-aca9-8a6e45361f55\nhdl:21.14100/7aa3797a-b0e7-427d-a209-efed00cd1724\nhdl:21.14100/33d3ae45-cb42-47e5-8c08-76df86d298a8\nhdl:21.14100/10f9c9e3-3d54-494a-b153-ea63c5b584c7\nhdl:21.14100/2a3a1f67-8890-4e89-b6de-84b2b13cf70e\nhdl:21.14100/447d4151-8161-461a-a66e-f21144baabf6\nhdl:21.14100/c1bd13af-f8b2-4b18-bd2c-34b13a4921dc\nhdl:21.14100/eee79e49-dd70-4d8f-b195-c885aca26e3a\nhdl:21.14100/7cd2e526-a94c-4004-bfe8-32832a9df6d7\nhdl:21.14100/b2421ba2-c8c9-44c0-84af-f9b09cb87759\nhdl:21.14100/f87b3cf5-e68d-40f2-a289-667b4cf7d15f\nhdl:21.14100/a6542f1a-0567-4e7a-b063-f5609f017d69\nhdl:21.14100/01e4e8d6-b84e-4d25-9f50-4a9ea5588f07'
Regrid CMIP6 data to common NorESM2-LM grid
Select a time range
we use
squeezeto remove dimension with one element only e.g. member_id=’r1i1p1f1’
starty = 1985; endy = 1986
year_range = range(starty, endy+1)
# Read in the output grid from NorESM
ds_out = ds.sel(time = ds.time.dt.year.isin(year_range)).squeeze()
ds_out
<xarray.Dataset>
Dimensions:     (bnds: 2, lat: 96, lon: 144, time: 24)
Coordinates:
  * lat         (lat) float64 -90.0 -88.11 -86.21 -84.32 ... 86.21 88.11 90.0
    lat_bnds    (lat, bnds) float64 dask.array<chunksize=(96, 2), meta=np.ndarray>
  * lon         (lon) float64 0.0 2.5 5.0 7.5 10.0 ... 350.0 352.5 355.0 357.5
    lon_bnds    (lon, bnds) float64 dask.array<chunksize=(144, 2), meta=np.ndarray>
  * time        (time) object 1985-01-16 12:00:00 ... 1986-12-16 12:00:00
    time_bnds   (time, bnds) object dask.array<chunksize=(24, 2), meta=np.ndarray>
    wavelength  float64 ...
    member_id   <U8 'r1i1p1f1'
Dimensions without coordinates: bnds
Data variables:
    od550aer    (time, lat, lon) float32 dask.array<chunksize=(24, 96, 144), meta=np.ndarray>
Attributes: (12/52)
    Conventions:               CF-1.7 CMIP-6.2
    activity_id:               CMIP
    branch_method:             Hybrid-restart from year 1600-01-01 of piControl
    branch_time:               0.0
    branch_time_in_child:      0.0
    branch_time_in_parent:     430335.0
    ...                        ...
    title:                     NorESM2-LM output prepared for CMIP6
    tracking_id:               hdl:21.14100/efd7a56e-94a8-47f5-b3d8-06ae02268...
    variable_id:               od550aer
    variant_label:             r1i1p1f1
    intake_esm_varname:        ['od550aer']
    intake_esm_dataset_key:    CMIP.NCC.NorESM2-LM.historical.AERmon.gn
xarray.Dataset
- bnds: 2
- lat: 96
- lon: 144
- time: 24
- lat(lat)float64-90.0 -88.11 -86.21 ... 88.11 90.0
- axis :
- Y
- bounds :
- lat_bnds
- long_name :
- Latitude
- standard_name :
- latitude
- units :
- degrees_north
array([-90. , -88.105263, -86.210526, -84.315789, -82.421053, -80.526316, -78.631579, -76.736842, -74.842105, -72.947368, -71.052632, -69.157895, -67.263158, -65.368421, -63.473684, -61.578947, -59.684211, -57.789474, -55.894737, -54. , -52.105263, -50.210526, -48.315789, -46.421053, -44.526316, -42.631579, -40.736842, -38.842105, -36.947368, -35.052632, -33.157895, -31.263158, -29.368421, -27.473684, -25.578947, -23.684211, -21.789474, -19.894737, -18. , -16.105263, -14.210526, -12.315789, -10.421053, -8.526316, -6.631579, -4.736842, -2.842105, -0.947368, 0.947368, 2.842105, 4.736842, 6.631579, 8.526316, 10.421053, 12.315789, 14.210526, 16.105263, 18. , 19.894737, 21.789474, 23.684211, 25.578947, 27.473684, 29.368421, 31.263158, 33.157895, 35.052632, 36.947368, 38.842105, 40.736842, 42.631579, 44.526316, 46.421053, 48.315789, 50.210526, 52.105263, 54. , 55.894737, 57.789474, 59.684211, 61.578947, 63.473684, 65.368421, 67.263158, 69.157895, 71.052632, 72.947368, 74.842105, 76.736842, 78.631579, 80.526316, 82.421053, 84.315789, 86.210526, 88.105263, 90. ]) - lat_bnds(lat, bnds)float64dask.array<chunksize=(96, 2), meta=np.ndarray>
Array Chunk Bytes 1.54 kB 1.54 kB Shape (96, 2) (96, 2) Count 2 Tasks 1 Chunks Type float64 numpy.ndarray - lon(lon)float640.0 2.5 5.0 ... 352.5 355.0 357.5
- axis :
- X
- bounds :
- lon_bnds
- long_name :
- Longitude
- standard_name :
- longitude
- units :
- degrees_east
array([ 0. , 2.5, 5. , 7.5, 10. , 12.5, 15. , 17.5, 20. , 22.5, 25. , 27.5, 30. , 32.5, 35. , 37.5, 40. , 42.5, 45. , 47.5, 50. , 52.5, 55. , 57.5, 60. , 62.5, 65. , 67.5, 70. , 72.5, 75. , 77.5, 80. , 82.5, 85. , 87.5, 90. , 92.5, 95. , 97.5, 100. , 102.5, 105. , 107.5, 110. , 112.5, 115. , 117.5, 120. , 122.5, 125. , 127.5, 130. , 132.5, 135. , 137.5, 140. , 142.5, 145. , 147.5, 150. , 152.5, 155. , 157.5, 160. , 162.5, 165. , 167.5, 170. , 172.5, 175. , 177.5, 180. , 182.5, 185. , 187.5, 190. , 192.5, 195. , 197.5, 200. , 202.5, 205. , 207.5, 210. , 212.5, 215. , 217.5, 220. , 222.5, 225. , 227.5, 230. , 232.5, 235. , 237.5, 240. , 242.5, 245. , 247.5, 250. , 252.5, 255. , 257.5, 260. , 262.5, 265. , 267.5, 270. , 272.5, 275. , 277.5, 280. , 282.5, 285. , 287.5, 290. , 292.5, 295. , 297.5, 300. , 302.5, 305. , 307.5, 310. , 312.5, 315. , 317.5, 320. , 322.5, 325. , 327.5, 330. , 332.5, 335. , 337.5, 340. , 342.5, 345. , 347.5, 350. , 352.5, 355. , 357.5]) - lon_bnds(lon, bnds)float64dask.array<chunksize=(144, 2), meta=np.ndarray>
Array Chunk Bytes 2.30 kB 2.30 kB Shape (144, 2) (144, 2) Count 2 Tasks 1 Chunks Type float64 numpy.ndarray - time(time)object1985-01-16 12:00:00 ... 1986-12-...
- axis :
- T
- bounds :
- time_bnds
- long_name :
- time
- standard_name :
- time
array([cftime.DatetimeNoLeap(1985, 1, 16, 12, 0, 0, 0), cftime.DatetimeNoLeap(1985, 2, 15, 0, 0, 0, 0), cftime.DatetimeNoLeap(1985, 3, 16, 12, 0, 0, 0), cftime.DatetimeNoLeap(1985, 4, 16, 0, 0, 0, 0), cftime.DatetimeNoLeap(1985, 5, 16, 12, 0, 0, 0), cftime.DatetimeNoLeap(1985, 6, 16, 0, 0, 0, 0), cftime.DatetimeNoLeap(1985, 7, 16, 12, 0, 0, 0), cftime.DatetimeNoLeap(1985, 8, 16, 12, 0, 0, 0), cftime.DatetimeNoLeap(1985, 9, 16, 0, 0, 0, 0), cftime.DatetimeNoLeap(1985, 10, 16, 12, 0, 0, 0), cftime.DatetimeNoLeap(1985, 11, 16, 0, 0, 0, 0), cftime.DatetimeNoLeap(1985, 12, 16, 12, 0, 0, 0), cftime.DatetimeNoLeap(1986, 1, 16, 12, 0, 0, 0), cftime.DatetimeNoLeap(1986, 2, 15, 0, 0, 0, 0), cftime.DatetimeNoLeap(1986, 3, 16, 12, 0, 0, 0), cftime.DatetimeNoLeap(1986, 4, 16, 0, 0, 0, 0), cftime.DatetimeNoLeap(1986, 5, 16, 12, 0, 0, 0), cftime.DatetimeNoLeap(1986, 6, 16, 0, 0, 0, 0), cftime.DatetimeNoLeap(1986, 7, 16, 12, 0, 0, 0), cftime.DatetimeNoLeap(1986, 8, 16, 12, 0, 0, 0), cftime.DatetimeNoLeap(1986, 9, 16, 0, 0, 0, 0), cftime.DatetimeNoLeap(1986, 10, 16, 12, 0, 0, 0), cftime.DatetimeNoLeap(1986, 11, 16, 0, 0, 0, 0), cftime.DatetimeNoLeap(1986, 12, 16, 12, 0, 0, 0)], dtype=object) - time_bnds(time, bnds)objectdask.array<chunksize=(24, 2), meta=np.ndarray>
Array Chunk Bytes 384 B 384 B Shape (24, 2) (24, 2) Count 3 Tasks 1 Chunks Type object numpy.ndarray - wavelength()float64...
- long_name :
- Radiation Wavelength 550 nanometers
- standard_name :
- radiation_wavelength
- units :
- nm
array(550.)
- member_id()<U8'r1i1p1f1'
array('r1i1p1f1', dtype='<U8')
- od550aer(time, lat, lon)float32dask.array<chunksize=(24, 96, 144), meta=np.ndarray>
- cell_measures :
- area: areacella
- cell_methods :
- area: time: mean
- comment :
- AOD from the ambient aerosols (i.e., includes aerosol water). Does not include AOD from stratospheric aerosols if these are prescribed but includes other possible background aerosol types. Needs a comment attribute 'wavelength: 550nm'
- history :
- 2019-08-15T14:30:44Z altered by CMOR: Treated scalar dimension: 'wavelength'. 2019-08-15T14:30:45Z altered by CMOR: Converted type from 'd' to 'f'.
- long_name :
- Ambient Aerosol Optical Thickness at 550nm
- original_name :
- DOD550
- standard_name :
- atmosphere_optical_thickness_due_to_ambient_aerosol_particles
- units :
- 1
Array Chunk Bytes 1.33 MB 1.33 MB Shape (24, 96, 144) (24, 96, 144) Count 7 Tasks 1 Chunks Type float32 numpy.ndarray
- Conventions :
- CF-1.7 CMIP-6.2
- activity_id :
- CMIP
- branch_method :
- Hybrid-restart from year 1600-01-01 of piControl
- branch_time :
- 0.0
- branch_time_in_child :
- 0.0
- branch_time_in_parent :
- 430335.0
- cmor_version :
- 3.5.0
- contact :
- Please send any requests or bug reports to noresm-ncc@met.no.
- creation_date :
- 2019-08-15T14:30:45Z
- data_specs_version :
- 01.00.31
- experiment :
- all-forcing simulation of the recent past
- experiment_id :
- historical
- external_variables :
- areacella
- forcing_index :
- 1
- frequency :
- mon
- further_info_url :
- https://furtherinfo.es-doc.org/CMIP6.NCC.NorESM2-LM.historical.none.r1i1p1f1
- grid :
- finite-volume grid with 1.9x2.5 degree lat/lon resolution
- grid_label :
- gn
- history :
- 2019-08-15T14:30:45Z ; CMOR rewrote data to be consistent with CMIP6, CF-1.7 CMIP-6.2 and CF standards.
- initialization_index :
- 1
- institution :
- NorESM Climate modeling Consortium consisting of CICERO (Center for International Climate and Environmental Research, Oslo 0349), MET-Norway (Norwegian Meteorological Institute, Oslo 0313), NERSC (Nansen Environmental and Remote Sensing Center, Bergen 5006), NILU (Norwegian Institute for Air Research, Kjeller 2027), UiB (University of Bergen, Bergen 5007), UiO (University of Oslo, Oslo 0313) and UNI (Uni Research, Bergen 5008), Norway. Mailing address: NCC, c/o MET-Norway, Henrik Mohns plass 1, Oslo 0313, Norway
- institution_id :
- NCC
- license :
- CMIP6 model data produced by NCC is licensed under a Creative Commons Attribution ShareAlike 4.0 International License (https://creativecommons.org/licenses). Consult https://pcmdi.llnl.gov/CMIP6/TermsOfUse for terms of use governing CMIP6 output, including citation requirements and proper acknowledgment. Further information about this data, including some limitations, can be found via the further_info_url (recorded as a global attribute in this file) and at https:///pcmdi.llnl.gov/. The data producers and data providers make no warranty, either express or implied, including, but not limited to, warranties of merchantability and fitness for a particular purpose. All liabilities arising from the supply of the information (including any liability arising in negligence) are excluded to the fullest extent permitted by law.
- mip_era :
- CMIP6
- model_id :
- NorESM2-LM
- nominal_resolution :
- 250 km
- parent_activity_id :
- CMIP
- parent_experiment_id :
- piControl
- parent_mip_era :
- CMIP6
- parent_source_id :
- NorESM2-LM
- parent_sub_experiment_id :
- none
- parent_time_units :
- days since 0421-01-01
- parent_variant_label :
- r1i1p1f1
- physics_index :
- 1
- product :
- model-output
- realization_index :
- 1
- realm :
- aerosol
- run_variant :
- N/A
- source :
- NorESM2-LM (2017): aerosol: OsloAero atmos: CAM-OSLO (2 degree resolution; 144 x 96; 32 levels; top level 3 mb) atmosChem: OsloChemSimp land: CLM landIce: CISM ocean: MICOM (1 degree resolution; 360 x 384; 70 levels; top grid cell minimum 0-2.5 m [native model uses hybrid density and generic upper-layer coordinate interpolated to z-level for contributed data]) ocnBgchem: HAMOCC seaIce: CICE
- source_id :
- NorESM2-LM
- source_type :
- AOGCM
- status :
- 2020-03-25;created; by gcs.cmip6.ldeo@gmail.com
- sub_experiment :
- none
- sub_experiment_id :
- none
- table_id :
- AERmon
- table_info :
- Creation Date:(24 July 2019) MD5:08e314340b9dd440c36c1b8e484514f4
- title :
- NorESM2-LM output prepared for CMIP6
- tracking_id :
- hdl:21.14100/efd7a56e-94a8-47f5-b3d8-06ae02268192 hdl:21.14100/0c3683e7-1c3f-45d6-bbc7-414f68e7a801 hdl:21.14100/a83a3a96-0d16-4f3e-aa88-a68f00e1ce2e hdl:21.14100/7a629db0-dda1-445d-a496-2e77c9c7c20a hdl:21.14100/388888f8-7ee4-467f-aca9-8a6e45361f55 hdl:21.14100/7aa3797a-b0e7-427d-a209-efed00cd1724 hdl:21.14100/33d3ae45-cb42-47e5-8c08-76df86d298a8 hdl:21.14100/10f9c9e3-3d54-494a-b153-ea63c5b584c7 hdl:21.14100/2a3a1f67-8890-4e89-b6de-84b2b13cf70e hdl:21.14100/447d4151-8161-461a-a66e-f21144baabf6 hdl:21.14100/c1bd13af-f8b2-4b18-bd2c-34b13a4921dc hdl:21.14100/eee79e49-dd70-4d8f-b195-c885aca26e3a hdl:21.14100/7cd2e526-a94c-4004-bfe8-32832a9df6d7 hdl:21.14100/b2421ba2-c8c9-44c0-84af-f9b09cb87759 hdl:21.14100/f87b3cf5-e68d-40f2-a289-667b4cf7d15f hdl:21.14100/a6542f1a-0567-4e7a-b063-f5609f017d69 hdl:21.14100/01e4e8d6-b84e-4d25-9f50-4a9ea5588f07
- variable_id :
- od550aer
- variant_label :
- r1i1p1f1
- intake_esm_varname :
- ['od550aer']
- intake_esm_dataset_key :
- CMIP.NCC.NorESM2-LM.historical.AERmon.gn
# create dictionary for reggridded data
ds_regrid_dict = dict()
for key in dset_dict.keys():
    print(key)
    ds_in = dset_dict[keys]
    ds_in = ds_in.sel(time = ds_in.time.dt.year.isin(year_range)).squeeze()
    regridder = xe.Regridder(ds_in, ds_out, 'bilinear')
    # Apply regridder to data
    # the entire dataset can be processed at once
    ds_in_regrid = regridder(ds_in, keep_attrs=True)
    # Save to netcdf file
    model = key.split('.')[2]
    filename = 'od550aer_AERmon.nc'
    savepath = 'CMIP6_hist/{}'.format(model)
    nc_out = os.path.join(savepath, filename)
    os.makedirs(savepath, exist_ok=True)
    ds_in_regrid.to_netcdf(nc_out)
    # create dataset with all models
    ds_regrid_dict[model] = ds_in_regrid
    print('file written: {}'.format(nc_out))
CMIP.MPI-M.MPI-ESM1-2-LR.historical.AERmon.gn
file written: CMIP6_hist/MPI-ESM1-2-LR/od550aer_AERmon.nc
CMIP.BCC.BCC-ESM1.historical.AERmon.gn
file written: CMIP6_hist/BCC-ESM1/od550aer_AERmon.nc
CMIP.NCAR.CESM2-WACCM.historical.AERmon.gn
file written: CMIP6_hist/CESM2-WACCM/od550aer_AERmon.nc
CMIP.MPI-M.MPI-ESM1-2-HR.historical.AERmon.gn
file written: CMIP6_hist/MPI-ESM1-2-HR/od550aer_AERmon.nc
CMIP.MRI.MRI-ESM2-0.historical.AERmon.gn
file written: CMIP6_hist/MRI-ESM2-0/od550aer_AERmon.nc
CMIP.CCCma.CanESM5.historical.AERmon.gn
file written: CMIP6_hist/CanESM5/od550aer_AERmon.nc
CMIP.NCAR.CESM2.historical.AERmon.gn
file written: CMIP6_hist/CESM2/od550aer_AERmon.nc
CMIP.NCC.NorESM2-LM.historical.AERmon.gn
file written: CMIP6_hist/NorESM2-LM/od550aer_AERmon.nc
CMIP.HAMMOZ-Consortium.MPI-ESM-1-2-HAM.historical.AERmon.gn
file written: CMIP6_hist/MPI-ESM-1-2-HAM/od550aer_AERmon.nc
CMIP.NCAR.CESM2-WACCM-FV2.historical.AERmon.gn
file written: CMIP6_hist/CESM2-WACCM-FV2/od550aer_AERmon.nc
CMIP.NCAR.CESM2-FV2.historical.AERmon.gn
file written: CMIP6_hist/CESM2-FV2/od550aer_AERmon.nc
Concatenate all models
_ds = list(ds_regrid_dict.values())
_coord = list(ds_regrid_dict.keys())
ds_out_regrid = xr.concat(objs=_ds, dim=_coord, coords="all").rename({'concat_dim':'model'})
ds_out_regrid
<xarray.Dataset>
Dimensions:    (lat: 96, lon: 144, model: 11, nbnd: 2, time: 24)
Coordinates:
  * time       (time) object 1985-01-15 12:00:00 ... 1986-12-15 12:00:00
    time_bnds  (model, time, nbnd) object dask.array<chunksize=(1, 24, 2), meta=np.ndarray>
    member_id  (model) <U8 'r1i1p1f1' 'r1i1p1f1' ... 'r1i1p1f1' 'r1i1p1f1'
  * lon        (lon) float64 0.0 2.5 5.0 7.5 10.0 ... 350.0 352.5 355.0 357.5
  * lat        (lat) float64 -90.0 -88.11 -86.21 -84.32 ... 86.21 88.11 90.0
  * model      (model) <U15 'MPI-ESM1-2-LR' 'BCC-ESM1' ... 'CESM2-FV2'
Dimensions without coordinates: nbnd
Data variables:
    od550aer   (model, time, lat, lon) float64 dask.array<chunksize=(1, 24, 96, 144), meta=np.ndarray>
Attributes: (12/49)
    Conventions:             CF-1.7 CMIP-6.2
    activity_id:             CMIP
    branch_method:           standard
    branch_time_in_child:    674885.0
    branch_time_in_parent:   10950.0
    case_id:                 1559
    ...                      ...
    variable_id:             od550aer
    variant_info:            CMIP6 CESM2-FV2 historical experiment (1850-2014...
    variant_label:           r1i1p1f1
    intake_esm_varname:      ['od550aer']
    intake_esm_dataset_key:  CMIP.NCAR.CESM2-FV2.historical.AERmon.gn
    regrid_method:           bilinear
xarray.Dataset
- lat: 96
- lon: 144
- model: 11
- nbnd: 2
- time: 24
- time(time)object1985-01-15 12:00:00 ... 1986-12-...
- axis :
- T
- bounds :
- time_bnds
- standard_name :
- time
- title :
- time
- type :
- double
array([cftime.DatetimeNoLeap(1985, 1, 15, 12, 0, 0, 0), cftime.DatetimeNoLeap(1985, 2, 14, 0, 0, 0, 0), cftime.DatetimeNoLeap(1985, 3, 15, 12, 0, 0, 0), cftime.DatetimeNoLeap(1985, 4, 15, 0, 0, 0, 0), cftime.DatetimeNoLeap(1985, 5, 15, 12, 0, 0, 0), cftime.DatetimeNoLeap(1985, 6, 15, 0, 0, 0, 0), cftime.DatetimeNoLeap(1985, 7, 15, 12, 0, 0, 0), cftime.DatetimeNoLeap(1985, 8, 15, 12, 0, 0, 0), cftime.DatetimeNoLeap(1985, 9, 15, 0, 0, 0, 0), cftime.DatetimeNoLeap(1985, 10, 15, 12, 0, 0, 0), cftime.DatetimeNoLeap(1985, 11, 15, 0, 0, 0, 0), cftime.DatetimeNoLeap(1985, 12, 15, 12, 0, 0, 0), cftime.DatetimeNoLeap(1986, 1, 15, 12, 0, 0, 0), cftime.DatetimeNoLeap(1986, 2, 14, 0, 0, 0, 0), cftime.DatetimeNoLeap(1986, 3, 15, 12, 0, 0, 0), cftime.DatetimeNoLeap(1986, 4, 15, 0, 0, 0, 0), cftime.DatetimeNoLeap(1986, 5, 15, 12, 0, 0, 0), cftime.DatetimeNoLeap(1986, 6, 15, 0, 0, 0, 0), cftime.DatetimeNoLeap(1986, 7, 15, 12, 0, 0, 0), cftime.DatetimeNoLeap(1986, 8, 15, 12, 0, 0, 0), cftime.DatetimeNoLeap(1986, 9, 15, 0, 0, 0, 0), cftime.DatetimeNoLeap(1986, 10, 15, 12, 0, 0, 0), cftime.DatetimeNoLeap(1986, 11, 15, 0, 0, 0, 0), cftime.DatetimeNoLeap(1986, 12, 15, 12, 0, 0, 0)], dtype=object) - time_bnds(model, time, nbnd)objectdask.array<chunksize=(1, 24, 2), meta=np.ndarray>
Array Chunk Bytes 4.22 kB 384 B Shape (11, 24, 2) (1, 24, 2) Count 15 Tasks 11 Chunks Type object numpy.ndarray - member_id(model)<U8'r1i1p1f1' ... 'r1i1p1f1'
array(['r1i1p1f1', 'r1i1p1f1', 'r1i1p1f1', 'r1i1p1f1', 'r1i1p1f1', 'r1i1p1f1', 'r1i1p1f1', 'r1i1p1f1', 'r1i1p1f1', 'r1i1p1f1', 'r1i1p1f1'], dtype='<U8') - lon(lon)float640.0 2.5 5.0 ... 352.5 355.0 357.5
- axis :
- X
- bounds :
- lon_bnds
- long_name :
- Longitude
- standard_name :
- longitude
- units :
- degrees_east
array([ 0. , 2.5, 5. , 7.5, 10. , 12.5, 15. , 17.5, 20. , 22.5, 25. , 27.5, 30. , 32.5, 35. , 37.5, 40. , 42.5, 45. , 47.5, 50. , 52.5, 55. , 57.5, 60. , 62.5, 65. , 67.5, 70. , 72.5, 75. , 77.5, 80. , 82.5, 85. , 87.5, 90. , 92.5, 95. , 97.5, 100. , 102.5, 105. , 107.5, 110. , 112.5, 115. , 117.5, 120. , 122.5, 125. , 127.5, 130. , 132.5, 135. , 137.5, 140. , 142.5, 145. , 147.5, 150. , 152.5, 155. , 157.5, 160. , 162.5, 165. , 167.5, 170. , 172.5, 175. , 177.5, 180. , 182.5, 185. , 187.5, 190. , 192.5, 195. , 197.5, 200. , 202.5, 205. , 207.5, 210. , 212.5, 215. , 217.5, 220. , 222.5, 225. , 227.5, 230. , 232.5, 235. , 237.5, 240. , 242.5, 245. , 247.5, 250. , 252.5, 255. , 257.5, 260. , 262.5, 265. , 267.5, 270. , 272.5, 275. , 277.5, 280. , 282.5, 285. , 287.5, 290. , 292.5, 295. , 297.5, 300. , 302.5, 305. , 307.5, 310. , 312.5, 315. , 317.5, 320. , 322.5, 325. , 327.5, 330. , 332.5, 335. , 337.5, 340. , 342.5, 345. , 347.5, 350. , 352.5, 355. , 357.5]) - lat(lat)float64-90.0 -88.11 -86.21 ... 88.11 90.0
- axis :
- Y
- bounds :
- lat_bnds
- long_name :
- Latitude
- standard_name :
- latitude
- units :
- degrees_north
array([-90. , -88.105263, -86.210526, -84.315789, -82.421053, -80.526316, -78.631579, -76.736842, -74.842105, -72.947368, -71.052632, -69.157895, -67.263158, -65.368421, -63.473684, -61.578947, -59.684211, -57.789474, -55.894737, -54. , -52.105263, -50.210526, -48.315789, -46.421053, -44.526316, -42.631579, -40.736842, -38.842105, -36.947368, -35.052632, -33.157895, -31.263158, -29.368421, -27.473684, -25.578947, -23.684211, -21.789474, -19.894737, -18. , -16.105263, -14.210526, -12.315789, -10.421053, -8.526316, -6.631579, -4.736842, -2.842105, -0.947368, 0.947368, 2.842105, 4.736842, 6.631579, 8.526316, 10.421053, 12.315789, 14.210526, 16.105263, 18. , 19.894737, 21.789474, 23.684211, 25.578947, 27.473684, 29.368421, 31.263158, 33.157895, 35.052632, 36.947368, 38.842105, 40.736842, 42.631579, 44.526316, 46.421053, 48.315789, 50.210526, 52.105263, 54. , 55.894737, 57.789474, 59.684211, 61.578947, 63.473684, 65.368421, 67.263158, 69.157895, 71.052632, 72.947368, 74.842105, 76.736842, 78.631579, 80.526316, 82.421053, 84.315789, 86.210526, 88.105263, 90. ]) - model(model)<U15'MPI-ESM1-2-LR' ... 'CESM2-FV2'
array(['MPI-ESM1-2-LR', 'BCC-ESM1', 'CESM2-WACCM', 'MPI-ESM1-2-HR',
       'MRI-ESM2-0', 'CanESM5', 'CESM2', 'NorESM2-LM', 'MPI-ESM-1-2-HAM',
       'CESM2-WACCM-FV2', 'CESM2-FV2'], dtype='<U15')
- od550aer(model, time, lat, lon)float64dask.array<chunksize=(1, 24, 96, 144), meta=np.ndarray>
- cell_measures :
- area: areacella
- cell_methods :
- area: time: mean
- comment :
- AODVISdn
- description :
- AOD from ambient aerosols (i.e., includes aerosol water). Does not include AOD from stratospheric aerosols if these are prescribed but includes other possible background aerosol types. Needs a comment attribute "wavelength: 550 nm"
- frequency :
- mon
- id :
- od550aer
- long_name :
- Ambient Aerosol Optical Thickness at 550nm
- mipTable :
- AERmon
- out_name :
- od550aer
- prov :
- AERmon ((isd.003))
- realm :
- aerosol
- standard_name :
- atmosphere_optical_thickness_due_to_ambient_aerosol_particles
- time :
- time
- time_label :
- time-mean
- time_title :
- Temporal mean
- title :
- Ambient Aerosol Optical Thickness at 550nm
- type :
- real
- units :
- 1
- variable_id :
- od550aer
Array Chunk Bytes 29.20 MB 2.65 MB Shape (11, 24, 96, 144) (1, 24, 96, 144) Count 22 Tasks 11 Chunks Type float64 numpy.ndarray
- Conventions :
- CF-1.7 CMIP-6.2
- activity_id :
- CMIP
- branch_method :
- standard
- branch_time_in_child :
- 674885.0
- branch_time_in_parent :
- 10950.0
- case_id :
- 1559
- cesm_casename :
- b.e21.BHIST.f19_g17.CMIP6-historical-2deg.001
- contact :
- cesm_cmip6@ucar.edu
- creation_date :
- 2019-07-31T15:48:41Z
- data_specs_version :
- 01.00.31
- experiment :
- Simulation of recent past (1850 to 2014). Impose changing conditions (consistent with observations). Should be initialised from a point early enough in the pre-industrial control run to ensure that the end of all the perturbed runs branching from the end of this historical run end before the end of the control. Only one ensemble member is requested but modelling groups are strongly encouraged to submit at least three ensemble members of their CMIP historical simulation.
- experiment_id :
- historical
- external_variables :
- areacella
- forcing_index :
- 1
- frequency :
- mon
- further_info_url :
- https://furtherinfo.es-doc.org/CMIP6.NCAR.CESM2-FV2.historical.none.r1i1p1f1
- grid :
- native 1.9x2.5 finite volume grid (96x144 latxlon)
- grid_label :
- gn
- initialization_index :
- 1
- institution :
- National Center for Atmospheric Research, Climate and Global Dynamics Laboratory, 1850 Table Mesa Drive, Boulder, CO 80305, USA
- institution_id :
- NCAR
- license :
- CMIP6 model data produced by <The National Center for Atmospheric Research> is licensed under a Creative Commons Attribution-[]ShareAlike 4.0 International License (https://creativecommons.org/licenses/). Consult https://pcmdi.llnl.gov/CMIP6/TermsOfUse for terms of use governing CMIP6 output, including citation requirements and proper acknowledgment. Further information about this data, including some limitations, can be found via the further_info_url (recorded as a global attribute in this file)[]. The data producers and data providers make no warranty, either express or implied, including, but not limited to, warranties of merchantability and fitness for a particular purpose. All liabilities arising from the supply of the information (including any liability arising in negligence) are excluded to the fullest extent permitted by law.
- mip_era :
- CMIP6
- model_doi_url :
- https://doi.org/10.5065/D67H1H0V
- nominal_resolution :
- 250 km
- parent_activity_id :
- CMIP
- parent_experiment_id :
- piControl
- parent_mip_era :
- CMIP6
- parent_source_id :
- CESM2-FV2
- parent_time_units :
- days since 0001-01-01 00:00:00
- parent_variant_label :
- r1i1p1f1
- physics_index :
- 1
- product :
- model-output
- realization_index :
- 1
- realm :
- aerosol
- source :
- CESM2 (2017): atmosphere: CAM6 (1.9x2.5 finite volume grid; 144 x 96 longitude/latitude; 32 levels; top level 2.25 mb); ocean: POP2 (320x384 longitude/latitude; 60 levels; top grid cell 0-10 m); sea_ice: CICE5.1 (same grid as ocean); land: CLM5 1.9x2.5 finite volume grid; 144 x 96 longitude/latitude; 32 levels; top level 2.25 mb); aerosol: MAM4 (1.9x2.5 finite volume grid; 144 x 96 longitude/latitude; 32 levels; top level 2.25 mb); atmoschem: MAM4 (1.9x2.5 finite volume grid; 144 x 96 longitude/latitude; 32 levels; top level 2.25 mb); landIce: CISM2.1; ocnBgchem: MARBL (320x384 longitude/latitude; 60 levels; top grid cell 0-10 m)
- source_id :
- CESM2-FV2
- source_type :
- AOGCM BGC AER
- status :
- 2020-03-25;created; by gcs.cmip6.ldeo@gmail.com
- sub_experiment :
- none
- sub_experiment_id :
- none
- table_id :
- AERmon
- tracking_id :
- hdl:21.14100/9b90d489-3171-4178-856b-837379636a2e hdl:21.14100/9b90d489-3171-4178-856b-837379636a2e hdl:21.14100/9b90d489-3171-4178-856b-837379636a2e hdl:21.14100/9b90d489-3171-4178-856b-837379636a2e
- variable_id :
- od550aer
- variant_info :
- CMIP6 CESM2-FV2 historical experiment (1850-2014) with CAM6-FV2 and interactive land CLM5 at 1.9 degree latitude x 2.5 degree longitude, coupled ocean (POP2) with biogeochemistry (MARBL), interactive sea ice (CICE5.1), and non-evolving land ice (CISM2.1).
- variant_label :
- r1i1p1f1
- intake_esm_varname :
- ['od550aer']
- intake_esm_dataset_key :
- CMIP.NCAR.CESM2-FV2.historical.AERmon.gn
- regrid_method :
- bilinear
Compute seasonal mean of all regridded models
ds_seas = ds_out_regrid.mean('model', keep_attrs=True, skipna = True).groupby('time.season').mean('time', keep_attrs=True, skipna = True)
ds_seas
<xarray.Dataset>
Dimensions:   (lat: 96, lon: 144, season: 4)
Coordinates:
  * lon       (lon) float64 0.0 2.5 5.0 7.5 10.0 ... 350.0 352.5 355.0 357.5
  * lat       (lat) float64 -90.0 -88.11 -86.21 -84.32 ... 86.21 88.11 90.0
  * season    (season) object 'DJF' 'JJA' 'MAM' 'SON'
Data variables:
    od550aer  (season, lat, lon) float64 dask.array<chunksize=(1, 96, 144), meta=np.ndarray>
Attributes: (12/49)
    Conventions:             CF-1.7 CMIP-6.2
    activity_id:             CMIP
    branch_method:           standard
    branch_time_in_child:    674885.0
    branch_time_in_parent:   10950.0
    case_id:                 1559
    ...                      ...
    variable_id:             od550aer
    variant_info:            CMIP6 CESM2-FV2 historical experiment (1850-2014...
    variant_label:           r1i1p1f1
    intake_esm_varname:      ['od550aer']
    intake_esm_dataset_key:  CMIP.NCAR.CESM2-FV2.historical.AERmon.gn
    regrid_method:           bilinear
xarray.Dataset
- lat: 96
- lon: 144
- season: 4
- lon(lon)float640.0 2.5 5.0 ... 352.5 355.0 357.5
- axis :
- X
- bounds :
- lon_bnds
- long_name :
- Longitude
- standard_name :
- longitude
- units :
- degrees_east
array([ 0. , 2.5, 5. , 7.5, 10. , 12.5, 15. , 17.5, 20. , 22.5, 25. , 27.5, 30. , 32.5, 35. , 37.5, 40. , 42.5, 45. , 47.5, 50. , 52.5, 55. , 57.5, 60. , 62.5, 65. , 67.5, 70. , 72.5, 75. , 77.5, 80. , 82.5, 85. , 87.5, 90. , 92.5, 95. , 97.5, 100. , 102.5, 105. , 107.5, 110. , 112.5, 115. , 117.5, 120. , 122.5, 125. , 127.5, 130. , 132.5, 135. , 137.5, 140. , 142.5, 145. , 147.5, 150. , 152.5, 155. , 157.5, 160. , 162.5, 165. , 167.5, 170. , 172.5, 175. , 177.5, 180. , 182.5, 185. , 187.5, 190. , 192.5, 195. , 197.5, 200. , 202.5, 205. , 207.5, 210. , 212.5, 215. , 217.5, 220. , 222.5, 225. , 227.5, 230. , 232.5, 235. , 237.5, 240. , 242.5, 245. , 247.5, 250. , 252.5, 255. , 257.5, 260. , 262.5, 265. , 267.5, 270. , 272.5, 275. , 277.5, 280. , 282.5, 285. , 287.5, 290. , 292.5, 295. , 297.5, 300. , 302.5, 305. , 307.5, 310. , 312.5, 315. , 317.5, 320. , 322.5, 325. , 327.5, 330. , 332.5, 335. , 337.5, 340. , 342.5, 345. , 347.5, 350. , 352.5, 355. , 357.5]) - lat(lat)float64-90.0 -88.11 -86.21 ... 88.11 90.0
- axis :
- Y
- bounds :
- lat_bnds
- long_name :
- Latitude
- standard_name :
- latitude
- units :
- degrees_north
array([-90. , -88.105263, -86.210526, -84.315789, -82.421053, -80.526316, -78.631579, -76.736842, -74.842105, -72.947368, -71.052632, -69.157895, -67.263158, -65.368421, -63.473684, -61.578947, -59.684211, -57.789474, -55.894737, -54. , -52.105263, -50.210526, -48.315789, -46.421053, -44.526316, -42.631579, -40.736842, -38.842105, -36.947368, -35.052632, -33.157895, -31.263158, -29.368421, -27.473684, -25.578947, -23.684211, -21.789474, -19.894737, -18. , -16.105263, -14.210526, -12.315789, -10.421053, -8.526316, -6.631579, -4.736842, -2.842105, -0.947368, 0.947368, 2.842105, 4.736842, 6.631579, 8.526316, 10.421053, 12.315789, 14.210526, 16.105263, 18. , 19.894737, 21.789474, 23.684211, 25.578947, 27.473684, 29.368421, 31.263158, 33.157895, 35.052632, 36.947368, 38.842105, 40.736842, 42.631579, 44.526316, 46.421053, 48.315789, 50.210526, 52.105263, 54. , 55.894737, 57.789474, 59.684211, 61.578947, 63.473684, 65.368421, 67.263158, 69.157895, 71.052632, 72.947368, 74.842105, 76.736842, 78.631579, 80.526316, 82.421053, 84.315789, 86.210526, 88.105263, 90. ]) - season(season)object'DJF' 'JJA' 'MAM' 'SON'
array(['DJF', 'JJA', 'MAM', 'SON'], dtype=object)
- od550aer(season, lat, lon)float64dask.array<chunksize=(1, 96, 144), meta=np.ndarray>
- cell_measures :
- area: areacella
- cell_methods :
- area: time: mean
- comment :
- AODVISdn
- description :
- AOD from ambient aerosols (i.e., includes aerosol water). Does not include AOD from stratospheric aerosols if these are prescribed but includes other possible background aerosol types. Needs a comment attribute "wavelength: 550 nm"
- frequency :
- mon
- id :
- od550aer
- long_name :
- Ambient Aerosol Optical Thickness at 550nm
- mipTable :
- AERmon
- out_name :
- od550aer
- prov :
- AERmon ((isd.003))
- realm :
- aerosol
- standard_name :
- atmosphere_optical_thickness_due_to_ambient_aerosol_particles
- time :
- time
- time_label :
- time-mean
- time_title :
- Temporal mean
- title :
- Ambient Aerosol Optical Thickness at 550nm
- type :
- real
- units :
- 1
- variable_id :
- od550aer
Array Chunk Bytes 442.37 kB 110.59 kB Shape (4, 96, 144) (1, 96, 144) Count 57 Tasks 4 Chunks Type float64 numpy.ndarray
- Conventions :
- CF-1.7 CMIP-6.2
- activity_id :
- CMIP
- branch_method :
- standard
- branch_time_in_child :
- 674885.0
- branch_time_in_parent :
- 10950.0
- case_id :
- 1559
- cesm_casename :
- b.e21.BHIST.f19_g17.CMIP6-historical-2deg.001
- contact :
- cesm_cmip6@ucar.edu
- creation_date :
- 2019-07-31T15:48:41Z
- data_specs_version :
- 01.00.31
- experiment :
- Simulation of recent past (1850 to 2014). Impose changing conditions (consistent with observations). Should be initialised from a point early enough in the pre-industrial control run to ensure that the end of all the perturbed runs branching from the end of this historical run end before the end of the control. Only one ensemble member is requested but modelling groups are strongly encouraged to submit at least three ensemble members of their CMIP historical simulation.
- experiment_id :
- historical
- external_variables :
- areacella
- forcing_index :
- 1
- frequency :
- mon
- further_info_url :
- https://furtherinfo.es-doc.org/CMIP6.NCAR.CESM2-FV2.historical.none.r1i1p1f1
- grid :
- native 1.9x2.5 finite volume grid (96x144 latxlon)
- grid_label :
- gn
- initialization_index :
- 1
- institution :
- National Center for Atmospheric Research, Climate and Global Dynamics Laboratory, 1850 Table Mesa Drive, Boulder, CO 80305, USA
- institution_id :
- NCAR
- license :
- CMIP6 model data produced by <The National Center for Atmospheric Research> is licensed under a Creative Commons Attribution-[]ShareAlike 4.0 International License (https://creativecommons.org/licenses/). Consult https://pcmdi.llnl.gov/CMIP6/TermsOfUse for terms of use governing CMIP6 output, including citation requirements and proper acknowledgment. Further information about this data, including some limitations, can be found via the further_info_url (recorded as a global attribute in this file)[]. The data producers and data providers make no warranty, either express or implied, including, but not limited to, warranties of merchantability and fitness for a particular purpose. All liabilities arising from the supply of the information (including any liability arising in negligence) are excluded to the fullest extent permitted by law.
- mip_era :
- CMIP6
- model_doi_url :
- https://doi.org/10.5065/D67H1H0V
- nominal_resolution :
- 250 km
- parent_activity_id :
- CMIP
- parent_experiment_id :
- piControl
- parent_mip_era :
- CMIP6
- parent_source_id :
- CESM2-FV2
- parent_time_units :
- days since 0001-01-01 00:00:00
- parent_variant_label :
- r1i1p1f1
- physics_index :
- 1
- product :
- model-output
- realization_index :
- 1
- realm :
- aerosol
- source :
- CESM2 (2017): atmosphere: CAM6 (1.9x2.5 finite volume grid; 144 x 96 longitude/latitude; 32 levels; top level 2.25 mb); ocean: POP2 (320x384 longitude/latitude; 60 levels; top grid cell 0-10 m); sea_ice: CICE5.1 (same grid as ocean); land: CLM5 1.9x2.5 finite volume grid; 144 x 96 longitude/latitude; 32 levels; top level 2.25 mb); aerosol: MAM4 (1.9x2.5 finite volume grid; 144 x 96 longitude/latitude; 32 levels; top level 2.25 mb); atmoschem: MAM4 (1.9x2.5 finite volume grid; 144 x 96 longitude/latitude; 32 levels; top level 2.25 mb); landIce: CISM2.1; ocnBgchem: MARBL (320x384 longitude/latitude; 60 levels; top grid cell 0-10 m)
- source_id :
- CESM2-FV2
- source_type :
- AOGCM BGC AER
- status :
- 2020-03-25;created; by gcs.cmip6.ldeo@gmail.com
- sub_experiment :
- none
- sub_experiment_id :
- none
- table_id :
- AERmon
- tracking_id :
- hdl:21.14100/9b90d489-3171-4178-856b-837379636a2e hdl:21.14100/9b90d489-3171-4178-856b-837379636a2e hdl:21.14100/9b90d489-3171-4178-856b-837379636a2e hdl:21.14100/9b90d489-3171-4178-856b-837379636a2e
- variable_id :
- od550aer
- variant_info :
- CMIP6 CESM2-FV2 historical experiment (1850-2014) with CAM6-FV2 and interactive land CLM5 at 1.9 degree latitude x 2.5 degree longitude, coupled ocean (POP2) with biogeochemistry (MARBL), interactive sea ice (CICE5.1), and non-evolving land ice (CISM2.1).
- variant_label :
- r1i1p1f1
- intake_esm_varname :
- ['od550aer']
- intake_esm_dataset_key :
- CMIP.NCAR.CESM2-FV2.historical.AERmon.gn
- regrid_method :
- bilinear
ds_seas['od550aer'].min().compute(), ds_seas['od550aer'].max().compute()
(<xarray.DataArray 'od550aer' ()>
 array(0.0031875),
 <xarray.DataArray 'od550aer' ()>
 array(2.65120286))
Save seasonal mean in a new netCDF file and in the current Galaxy history
ds_seas.to_netcdf('CMIP6_hist/od550aer_seasonal.nc')
!put -p CMIP6_hist/od550aer_seasonal.nc -t netcdf
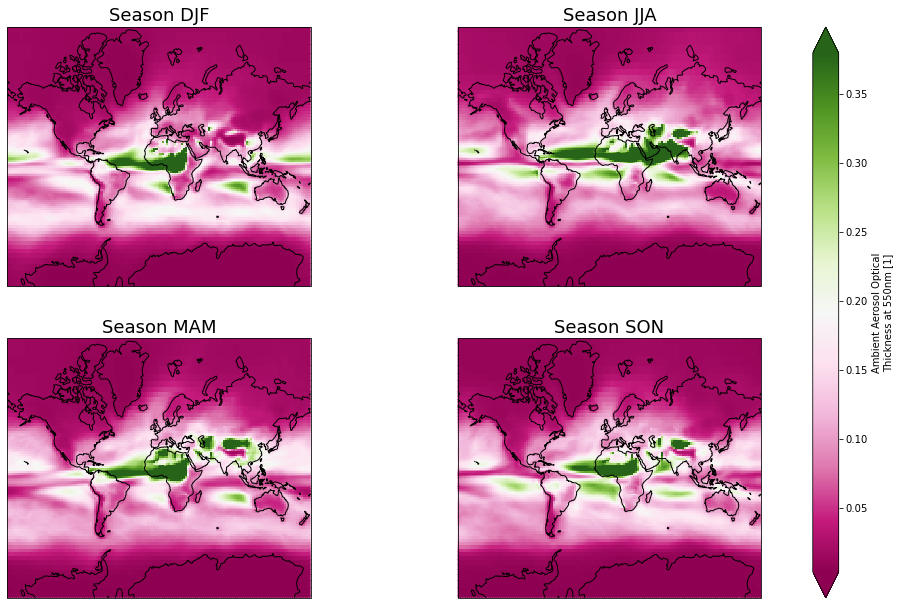
Visualize final results (seasonal mean for all models)
import matplotlib
proj_plot = ccrs.Mercator()

p = ds_seas['od550aer'].plot(x='lon', y='lat', transform=ccrs.PlateCarree(),
                             aspect=ds_seas.dims["lon"] / ds_seas.dims["lat"],  # for a sensible figsize
                             subplot_kws={"projection": proj_plot},
                             col='season', col_wrap=2, robust=True, cmap='PiYG')
# We have to set the map's options on all four axes
for ax,i in zip(p.axes.flat,  ds_seas.season.values):
    ax.coastlines()
    ax.set_title('Season '+i, fontsize=18)
fig = matplotlib.pyplot.gcf()
fig.set_size_inches(18.5, 10.5)
fig.savefig('od550aer_seasonal_mean.png', dpi=100)