Reading AERONET data with pandas
Contents
Reading AERONET data with pandas
Import python packages
import pandas as pd
import s3fs
import xarray as xr
Connect to bucket (anonymous login for public data only)
fs = s3fs.S3FileSystem(anon=True,
      client_kwargs={
         'endpoint_url': 'https://climate.uiogeo-apps.sigma2.no/'
      })

s3path = 'ESGF/obs4MIPs/AERONET/AeronetSunV3Lev1.5.daily/*.lev30'
remote_files = fs.glob(s3path)
Access data files
# Iterate through remote_files to create a fileset
fileset = [fs.open(file) for file in remote_files]
Station selection
# Get index of the first file containing some substring
matching_index = [i for i, s in enumerate(remote_files) if "Lille" in s][0]
matching_index
776
Data reading with pandas
# Read file with pandas
# Note: One must skip the first rows (skiprows), which do not contain as many columns as data-rows
df = pd.read_csv(fileset[matching_index], skiprows=6)
df.head()
| AERONET_Site | Date(dd:mm:yyyy) | Time(hh:mm:ss) | Day_of_Year | AOD_1640nm | AOD_1020nm | AOD_870nm | AOD_865nm | AOD_779nm | AOD_675nm | ... | N[440-675_Angstrom_Exponent] | N[500-870_Angstrom_Exponent] | N[340-440_Angstrom_Exponent] | N[440-675_Angstrom_Exponent[Polar]] | Data_Quality_Level | AERONET_Instrument_Number | AERONET_Site_Name | Site_Latitude(Degrees) | Site_Longitude(Degrees) | Site_Elevation(m) | |
|---|---|---|---|---|---|---|---|---|---|---|---|---|---|---|---|---|---|---|---|---|---|
| 0 | Lille | 01:11:1994 | 12:00:00 | 305 | -999.0 | 0.135490 | 0.146435 | -999.0 | -999.0 | 0.158098 | ... | 19 | 0 | 0 | 0 | lev15 | 48 | Lille | 50.611667 | 3.141667 | 60.0 |
| 1 | Lille | 02:11:1994 | 12:00:00 | 306 | -999.0 | 0.382259 | 0.396290 | -999.0 | -999.0 | 0.416910 | ... | 6 | 0 | 0 | 0 | lev15 | 48 | Lille | 50.611667 | 3.141667 | 60.0 |
| 2 | Lille | 06:11:1994 | 12:00:00 | 310 | -999.0 | 0.092989 | 0.118270 | -999.0 | -999.0 | 0.163379 | ... | 2 | 0 | 0 | 0 | lev15 | 48 | Lille | 50.611667 | 3.141667 | 60.0 |
| 3 | Lille | 07:11:1994 | 12:00:00 | 311 | -999.0 | 0.086925 | 0.108214 | -999.0 | -999.0 | 0.145579 | ... | 9 | 0 | 0 | 0 | lev15 | 48 | Lille | 50.611667 | 3.141667 | 60.0 |
| 4 | Lille | 08:11:1994 | 12:00:00 | 312 | -999.0 | 0.098722 | 0.120554 | -999.0 | -999.0 | 0.159143 | ... | 10 | 0 | 0 | 0 | lev15 | 48 | Lille | 50.611667 | 3.141667 | 60.0 |
5 rows × 82 columns
# Check which keys are available
df.keys()
Index(['AERONET_Site', 'Date(dd:mm:yyyy)', 'Time(hh:mm:ss)', 'Day_of_Year',
       'AOD_1640nm', 'AOD_1020nm', 'AOD_870nm', 'AOD_865nm', 'AOD_779nm',
       'AOD_675nm', 'AOD_667nm', 'AOD_620nm', 'AOD_560nm', 'AOD_555nm',
       'AOD_551nm', 'AOD_532nm', 'AOD_531nm', 'AOD_510nm', 'AOD_500nm',
       'AOD_490nm', 'AOD_443nm', 'AOD_440nm', 'AOD_412nm', 'AOD_400nm',
       'AOD_380nm', 'AOD_340nm', 'Precipitable_Water(cm)', 'AOD_681nm',
       'AOD_709nm', 'AOD_Empty', 'AOD_Empty.1', 'AOD_Empty.2', 'AOD_Empty.3',
       'AOD_Empty.4', '440-870_Angstrom_Exponent', '380-500_Angstrom_Exponent',
       '440-675_Angstrom_Exponent', '500-870_Angstrom_Exponent',
       '340-440_Angstrom_Exponent', '440-675_Angstrom_Exponent[Polar]',
       'N[AOD_1640nm]', 'N[AOD_1020nm]', 'N[AOD_870nm]', 'N[AOD_865nm]',
       'N[AOD_779nm]', 'N[AOD_675nm]', 'N[AOD_667nm]', 'N[AOD_620nm]',
       'N[AOD_560nm]', 'N[AOD_555nm]', 'N[AOD_551nm]', 'N[AOD_532nm]',
       'N[AOD_531nm]', 'N[AOD_510nm]', 'N[AOD_500nm]', 'N[AOD_490nm]',
       'N[AOD_443nm]', 'N[AOD_440nm]', 'N[AOD_412nm]', 'N[AOD_400nm]',
       'N[AOD_380nm]', 'N[AOD_340nm]', 'N[Precipitable_Water(cm)]',
       'N[AOD_681nm]', 'N[AOD_709nm]', 'N[AOD_Empty]', 'N[AOD_Empty].1',
       'N[AOD_Empty].2', 'N[AOD_Empty].3', 'N[AOD_Empty].4',
       'N[440-870_Angstrom_Exponent]', 'N[380-500_Angstrom_Exponent]',
       'N[440-675_Angstrom_Exponent]', 'N[500-870_Angstrom_Exponent]',
       'N[340-440_Angstrom_Exponent]', 'N[440-675_Angstrom_Exponent[Polar]]',
       'Data_Quality_Level', 'AERONET_Instrument_Number', 'AERONET_Site_Name',
       'Site_Latitude(Degrees)', 'Site_Longitude(Degrees)',
       'Site_Elevation(m)'],
      dtype='object')
Create proper Date index
# Get date from Date(dd:mm:yyyy)
df['Date'] = pd.to_datetime(df['Date(dd:mm:yyyy)'], format='%d:%m:%Y')

# Set date as index
df.set_index('Date', inplace=True)
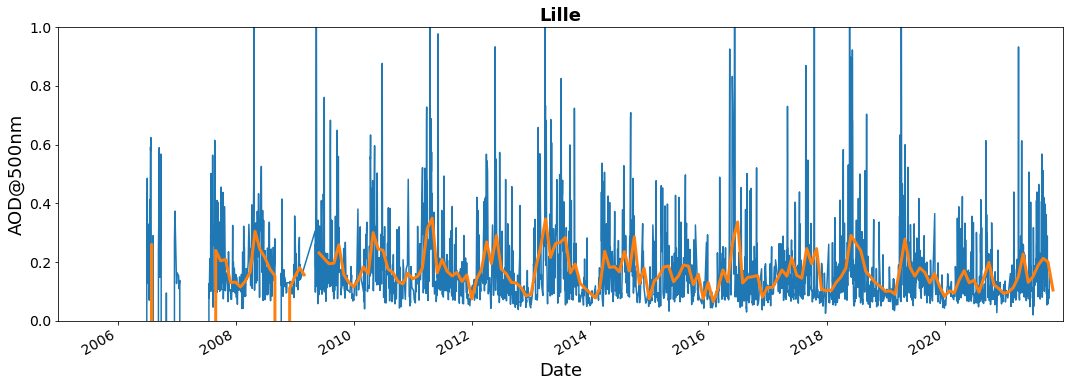
Plot time series using pandas
import matplotlib.pyplot as plt

fig=plt.figure(figsize=(18,6))
df['AOD_500nm'].plot(ylim=(0,1))
df['AOD_500nm'].resample('1M').mean().plot(ylim=(0,1), xlim=('01-01-2005','31-12-2021'), lw=3)
plt.title('Lille', weight='bold')
plt.ylabel('AOD@500nm')
Text(0, 0.5, 'AOD@500nm')