Search
RATECE-PLANICA ski station (Slovenia) under CMIP-6 SSP585 conditio

RATECE-PLANICA ski station (Slovenia) under CMIP-6 SSP585 condition

  • Description: SSP-based RCP scenario with high radiative forcing by the end of century. Following approximately RCP8.5 global forcing pathway with SSP5 socioeconomic conditions. Concentration-driven.
  • Rationale: the scenario represents the high end of plausible future pathways. SSP5 is the only SSP with emissions high enough to produce the 8.5 W/m2 level of forcing in 2100.
  • Full description on ES-DOC

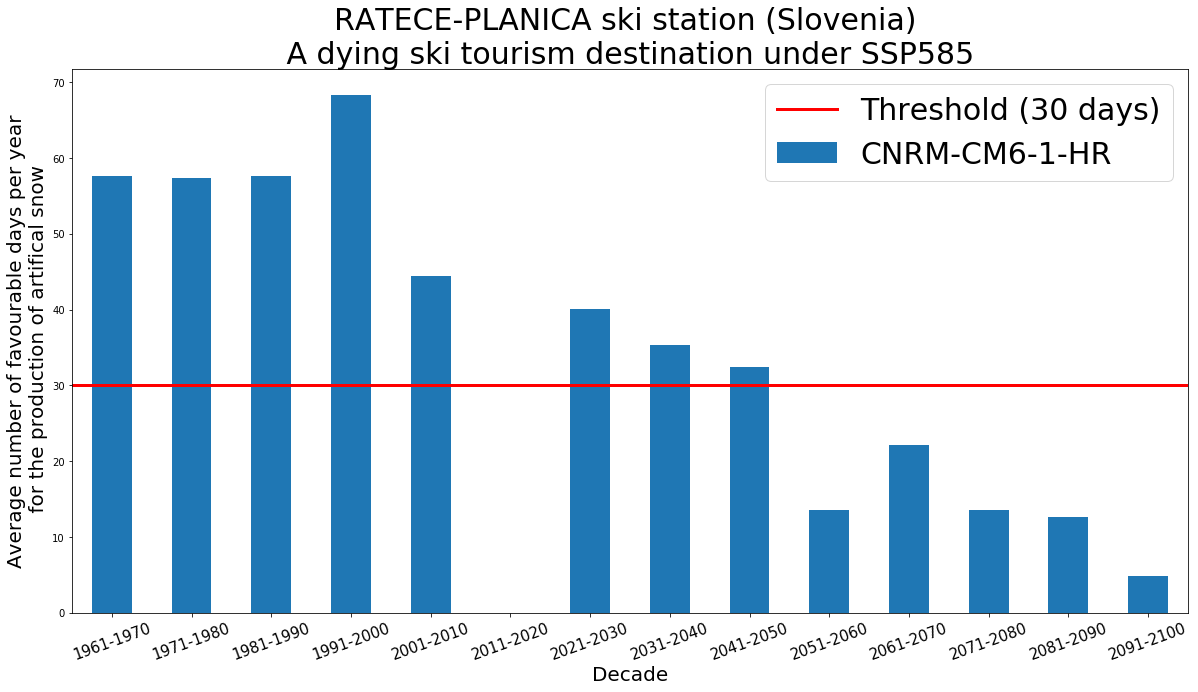
Is it worth investing in artificial snowmaking equipment at RATECE-PLANICA?

from ipyleaflet import Map, Marker, basemaps

center = (46.5, 13.70)

m = Map(
    basemap=basemaps.OpenTopoMap, 
    center=center,
    zoom=7
)
marker = Marker(location=center,  draggable=False)
m.add_layer(marker);
m
import xarray as xr
import pandas as pd
import cftime
import intake
from dask.distributed import Client
from dask.distributed import wait, progress
xr.set_options(display_style='html')
%matplotlib inline
/opt/conda/lib/python3.7/site-packages/matplotlib/font_manager.py:281: UserWarning: Matplotlib is building the font cache using fc-list. This may take a moment.
  'Matplotlib is building the font cache using fc-list. '

Step-1: Observation mean and standard deviation at RATECE-PLANICA station

Time series - daily RATECE-PLANICA average temperature

  • coordinates: 46.50N, 13.70E, 864.0m
  • GHCN-D station code: SIE00115206 RATECE-PLANICA Slovenia
filename = 'http://berkeleyearth.lbl.gov/auto/Stations/TAVG/Text/22498-TAVG-Data.txt'
data = pd.read_csv(filename, sep='\s+', header=None, comment='%')

Compute mean and standard deviation from 1961-2005

mean_st_1961_2005 = data[(data[0] >= 1961 ) & (data[0] <= 2005)][6].mean()
std_st_1961_2005 = data[(data[0] >= 1961 ) & (data[0] <= 2005)][6].std()
print(mean_st_1961_2005 + 273.15, std_st_1961_2005)
279.7723153988868 7.3015251282000255

Store results in csv file

# list of values 
lst = [mean_st_1961_2005 + 273.15, std_st_1961_2005] 
  
# Calling DataFrame constructor on list 
# with indices and columns specified 
df_st = pd.DataFrame(lst, index =['mean', 'stddev'], 
                                              columns =['RATECE-PLANICA-T2M-1961-2005']) 
df_st.to_csv('RATECE-PLANICA-1961-2005_t2m.csv') 
df_st
RATECE-PLANICA-T2M-1961-2005
mean 279.772315
stddev 7.301525

Step-2: CMIP-6 mean and standard deviation at RATECE-PLANICA

  • We will be using one model CNRM-CM6-1-HR

Check catalog and get model data

col_url = "https://raw.githubusercontent.com/NCAR/intake-esm-datastore/master/catalogs/pangeo-cmip6.json"
col = intake.open_esm_datastore(col_url)
cat = col.search(experiment_id=['historical', 'ssp585'], table_id='day',
          variable_id=['tas', 'tasmin', 'tasmax'], source_id='CNRM-CM6-1-HR', institution_id='CNRM-CERFACS')
cat.df
activity_id institution_id source_id experiment_id member_id table_id variable_id grid_label zstore dcpp_init_year
0 CMIP CNRM-CERFACS CNRM-CM6-1-HR historical r1i1p1f2 day tas gr gs://cmip6/CMIP/CNRM-CERFACS/CNRM-CM6-1-HR/his... NaN
1 CMIP CNRM-CERFACS CNRM-CM6-1-HR historical r1i1p1f2 day tasmax gr gs://cmip6/CMIP/CNRM-CERFACS/CNRM-CM6-1-HR/his... NaN
2 CMIP CNRM-CERFACS CNRM-CM6-1-HR historical r1i1p1f2 day tasmin gr gs://cmip6/CMIP/CNRM-CERFACS/CNRM-CM6-1-HR/his... NaN
3 ScenarioMIP CNRM-CERFACS CNRM-CM6-1-HR ssp585 r1i1p1f2 day tas gr gs://cmip6/ScenarioMIP/CNRM-CERFACS/CNRM-CM6-1... NaN
4 ScenarioMIP CNRM-CERFACS CNRM-CM6-1-HR ssp585 r1i1p1f2 day tasmax gr gs://cmip6/ScenarioMIP/CNRM-CERFACS/CNRM-CM6-1... NaN
5 ScenarioMIP CNRM-CERFACS CNRM-CM6-1-HR ssp585 r1i1p1f2 day tasmin gr gs://cmip6/ScenarioMIP/CNRM-CERFACS/CNRM-CM6-1... NaN
dset_dict = cat.to_dataset_dict(zarr_kwargs={'consolidated': True})
list(dset_dict.keys())
Progress: |███████████████████████████████████████████████████████████████████████████████| 100.0% 

--> The keys in the returned dictionary of datasets are constructed as follows:
	'activity_id.institution_id.source_id.experiment_id.table_id.grid_label'
             
--> There are 2 group(s)
['ScenarioMIP.CNRM-CERFACS.CNRM-CM6-1-HR.ssp585.day.gr',
 'CMIP.CNRM-CERFACS.CNRM-CM6-1-HR.historical.day.gr']

Create dask cluster

# Select 10 'workers' under 'manual scaling' menu below and click 'Scale'
# Click on the 'Dashboard link' to monitor calculation progress
from dask.distributed import Client
client = Client(n_workers=10, threads_per_worker=2, memory_limit='60GB')

Model mean and standard deviation 1961-2005

ds_hist = dset_dict['CMIP.CNRM-CERFACS.CNRM-CM6-1-HR.historical.day.gr']
ds_hist
Show/Hide data repr Show/Hide attributes
xarray.Dataset
    • axis_nbounds: 2
    • lat: 360
    • lon: 720
    • member_id: 1
    • time: 60265
    • time_bounds
      (time, axis_nbounds)
      datetime64[ns]
      dask.array<chunksize=(30133, 1), meta=np.ndarray>
      Array Chunk
      Bytes 964.24 kB 241.06 kB
      Shape (60265, 2) (30133, 1)
      Count 40 Tasks 4 Chunks
      Type datetime64[ns] numpy.ndarray
      2 60265
    • height
      ()
      float64
      2.0
      axis :
      Z
      long_name :
      height
      name :
      height
      positive :
      up
      standard_name :
      height
      units :
      m
      array(2.)
    • time
      (time)
      datetime64[ns]
      1850-01-01T12:00:00 ... 2014-12-31T12:00:00
      axis :
      T
      bounds :
      time_bounds
      long_name :
      Time axis
      standard_name :
      time
      time_origin :
      1850-01-01 00:00:00
      array(['1850-01-01T12:00:00.000000000', '1850-01-02T12:00:00.000000000',
             '1850-01-03T12:00:00.000000000', ..., '2014-12-29T12:00:00.000000000',
             '2014-12-30T12:00:00.000000000', '2014-12-31T12:00:00.000000000'],
            dtype='datetime64[ns]')
    • lat
      (lat)
      float64
      -89.62 -89.12 ... 89.12 89.62
      axis :
      Y
      long_name :
      Latitude
      standard_name :
      latitude
      units :
      degrees_north
      array([-89.617791, -89.122671, -88.624627, ...,  88.624627,  89.122671,
              89.617791])
    • lon
      (lon)
      float64
      0.0 0.5 1.0 ... 358.5 359.0 359.5
      axis :
      X
      long_name :
      Longitude
      standard_name :
      longitude
      units :
      degrees_east
      array([  0. ,   0.5,   1. , ..., 358.5, 359. , 359.5])
    • member_id
      (member_id)
      <U8
      'r1i1p1f2'
      array(['r1i1p1f2'], dtype='<U8')
    • tas
      (member_id, time, lat, lon)
      float32
      dask.array<chunksize=(1, 94, 360, 720), meta=np.ndarray>
      cell_measures :
      area: areacella
      cell_methods :
      area: time: mean
      description :
      Near-Surface Air Temperature
      history :
      none
      interval_operation :
      900 s
      interval_write :
      1 d
      long_name :
      Near-Surface Air Temperature
      online_operation :
      average
      standard_name :
      air_temperature
      units :
      K
      Array Chunk
      Bytes 62.48 GB 97.46 MB
      Shape (1, 60265, 360, 720) (1, 94, 360, 720)
      Count 1285 Tasks 642 Chunks
      Type float32 numpy.ndarray
      1 1 720 360 60265
    • tasmax
      (member_id, time, lat, lon)
      float32
      dask.array<chunksize=(1, 94, 360, 720), meta=np.ndarray>
      cell_measures :
      area: areacella
      cell_methods :
      area: mean time: maximum
      description :
      Daily Maximum Near-Surface Air Temperature
      history :
      none
      interval_operation :
      900 s
      interval_write :
      1 d
      long_name :
      Daily Maximum Near-Surface Air Temperature
      online_operation :
      maximum
      standard_name :
      air_temperature
      units :
      K
      Array Chunk
      Bytes 62.48 GB 97.46 MB
      Shape (1, 60265, 360, 720) (1, 94, 360, 720)
      Count 1285 Tasks 642 Chunks
      Type float32 numpy.ndarray
      1 1 720 360 60265
    • tasmin
      (member_id, time, lat, lon)
      float32
      dask.array<chunksize=(1, 93, 360, 720), meta=np.ndarray>
      cell_measures :
      area: areacella
      cell_methods :
      area: mean time: minimum
      description :
      Daily Minimum Near-Surface Air Temperature
      history :
      none
      interval_operation :
      900 s
      interval_write :
      1 d
      long_name :
      Daily Minimum Near-Surface Air Temperature
      online_operation :
      minimum
      standard_name :
      air_temperature
      units :
      K
      Array Chunk
      Bytes 62.48 GB 96.42 MB
      Shape (1, 60265, 360, 720) (1, 93, 360, 720)
      Count 1299 Tasks 649 Chunks
      Type float32 numpy.ndarray
      1 1 720 360 60265
  • grid :
    data regridded to a 359 gaussian grid (360x720 latlon) from a native atmosphere T359l reduced gaussian grid
    variant_label :
    r1i1p1f2
    grid_label :
    gr
    references :
    http://www.umr-cnrm.fr/cmip6/references
    parent_activity_id :
    C M I P
    external_variables :
    areacella
    xios_commit :
    1442-shuffle
    CMIP6_CV_version :
    cv=6.2.3.0-7-g2019642
    parent_time_units :
    days since 1850-01-01 00:00:00
    product :
    model-output
    realm :
    atmos
    institution_id :
    CNRM-CERFACS
    branch_time_in_parent :
    0.0
    branch_method :
    standard
    institution :
    CNRM (Centre National de Recherches Meteorologiques, Toulouse 31057, France), CERFACS (Centre Europeen de Recherche et de Formation Avancee en Calcul Scientifique, Toulouse 31057, France)
    license :
    CMIP6 model data produced by CNRM-CERFACS is licensed under a Creative Commons Attribution-NonCommercial-ShareAlike 4.0 International License (https://creativecommons.org/licenses). Consult https://pcmdi.llnl.gov/CMIP6/TermsOfUse for terms of use governing CMIP6 output, including citation requirements and proper acknowledgment. Further information about this data, including some limitations, can be found via the further_info_url (recorded as a global attribute in this file) and at http://www.umr-cnrm.fr/cmip6/. The data producers and data providers make no warranty, either express or implied, including, but not limited to, warranties of merchantability and fitness for a particular purpose. All liabilities arising from the supply of the information (including any liability arising in negligence) are excluded to the fullest extent permitted by law.
    parent_source_id :
    CNRM-CM6-1-HR
    intake_esm_varname :
    tasmin
    sub_experiment_id :
    none
    parent_mip_era :
    CMIP6
    status :
    2019-11-16;created;by nhn2@columbia.edu
    mip_era :
    CMIP6
    history :
    none
    nominal_resolution :
    50 km
    branch_time_in_child :
    0.0
    parent_experiment_id :
    p i C o n t r o l
    creation_date :
    2019-05-23T12:33:55Z
    dr2xml_version :
    1.16
    source_type :
    AOGCM
    EXPID :
    CNRM-CM6-1-HR_historical_r1i1p1f2
    source :
    CNRM-CM6-1-HR (2017): aerosol: prescribed monthly fields computed by TACTIC_v2 scheme atmos: Arpege 6.3 (T359; Gaussian Reduced with 181724 grid points in total distributed over 360 latitude circles (with 720 grid points per latitude circle between 32.2degN and 32.2degS reducing to 18 grid points per latitude circle at 89.6degN and 89.6degS); 91 levels; top level 78.4 km) atmosChem: OZL_v2 land: Surfex 8.0c ocean: Nemo 3.6 (eORCA025, tripolar primarily 1/4deg; 1442 x 1050 longitude/latitude; 75 levels; top grid cell 0-1 m) seaIce: Gelato 6.1
    sub_experiment :
    none
    source_id :
    CNRM-CM6-1-HR
    dr2xml_md5sum :
    45d4369d889ddfb8149d771d8625e9ec
    table_id :
    day
    activity_id :
    CMIP
    variable_id :
    tasmin
    frequency :
    day
    realization_index :
    1
    parent_variant_label :
    r1i1p1f2
    initialization_index :
    1
    forcing_index :
    2
    contact :
    contact.cmip@meteo.fr
    physics_index :
    1
    data_specs_version :
    01.00.21
    experiment :
    all-forcing simulation of the recent past
    nemo_gelato_commit :
    84a9e3f161dade7_8250e198106a168
    title :
    CNRM-CM6-1-HR model output prepared for CMIP6 and CMIP / historical simulation
    description :
    CMIP6 historical
    Conventions :
    CF-1.7 CMIP-6.2
    tracking_id :
    hdl:21.14100/8674f71e-9cba-4ef2-b5a5-8a5963e491c7 hdl:21.14100/6cf3b3d8-989d-42e1-aa96-7de36b399996 hdl:21.14100/072237fd-ac7a-4073-a499-ad3c6ff3bf65 hdl:21.14100/27c212f1-8891-4d79-815d-0eba4967f11c hdl:21.14100/ca2573b1-6c03-435d-8fd1-2ef17080b049 hdl:21.14100/36486bfe-612b-4a49-ae29-8baa11593a72 hdl:21.14100/f9bd3d5b-fb15-4172-b203-769cc1643bf4 hdl:21.14100/be4dc392-4c80-4dbd-b41f-0cefa310a4f2 hdl:21.14100/32917c9d-a567-4f47-8c8c-e25700ac721d hdl:21.14100/1632d713-ece5-4bbd-b747-8f8417f21f6a hdl:21.14100/35512ec6-f853-4a90-8bce-61473346405b hdl:21.14100/2a1229a2-a394-4ff1-bc75-2c156299d6d9
    experiment_id :
    historical
    further_info_url :
    https://furtherinfo.es-doc.org/CMIP6.CNRM-CERFACS.CNRM-CM6-1-HR.historical.none.r1i1p1f2
    arpege_minor_version :
    6.3.3
p = ds_hist['tas'].sel(time=slice(pd.datetime(1961, 1, 1), pd.datetime(2005, 12, 31))).sel(lat=46.5,lon=13.7, method="nearest")
/opt/conda/lib/python3.7/site-packages/ipykernel_launcher.py:1: FutureWarning: The pandas.datetime class is deprecated and will be removed from pandas in a future version. Import from datetime module instead.
  """Entry point for launching an IPython kernel.
p
Show/Hide data repr Show/Hide attributes
xarray.DataArray
'tas'
  • member_id: 1
  • time: 16435
  • dask.array<chunksize=(1, 66), meta=np.ndarray>
    Array Chunk
    Bytes 65.74 kB 376 B
    Shape (1, 16435) (1, 94)
    Count 1637 Tasks 176 Chunks
    Type float32 numpy.ndarray
    16435 1
    • height
      ()
      float64
      2.0
      axis :
      Z
      long_name :
      height
      name :
      height
      positive :
      up
      standard_name :
      height
      units :
      m
      array(2.)
    • time
      (time)
      datetime64[ns]
      1961-01-01T12:00:00 ... 2005-12-30T12:00:00
      axis :
      T
      bounds :
      time_bounds
      long_name :
      Time axis
      standard_name :
      time
      time_origin :
      1850-01-01 00:00:00
      array(['1961-01-01T12:00:00.000000000', '1961-01-02T12:00:00.000000000',
             '1961-01-03T12:00:00.000000000', ..., '2005-12-28T12:00:00.000000000',
             '2005-12-29T12:00:00.000000000', '2005-12-30T12:00:00.000000000'],
            dtype='datetime64[ns]')
    • lat
      ()
      float64
      46.69
      axis :
      Y
      long_name :
      Latitude
      standard_name :
      latitude
      units :
      degrees_north
      array(46.68510105)
    • lon
      ()
      float64
      13.5
      axis :
      X
      long_name :
      Longitude
      standard_name :
      longitude
      units :
      degrees_east
      array(13.5)
    • member_id
      (member_id)
      <U8
      'r1i1p1f2'
      array(['r1i1p1f2'], dtype='<U8')
  • cell_measures :
    area: areacella
    cell_methods :
    area: time: mean
    description :
    Near-Surface Air Temperature
    history :
    none
    interval_operation :
    900 s
    interval_write :
    1 d
    long_name :
    Near-Surface Air Temperature
    online_operation :
    average
    standard_name :
    air_temperature
    units :
    K
mean_cmip6_1961_2005 = p.mean().values
std_cmip6_1961_2005 = p.std().values
print(mean_cmip6_1961_2005, std_cmip6_1961_2005)
276.1684 8.298349
# list of values 
lst = [mean_cmip6_1961_2005, std_cmip6_1961_2005] 
  
# Calling DataFrame constructor on list 
# with indices and columns specified 
df_cmip6 = pd.DataFrame(lst, index =['mean', 'stddev'], 
                                              columns =['RATECE-PLANICA-T2M-1961-2005']) 
df_cmip6.to_csv('RATECE-PLANICA-1961-2005_t2m_cmip6.csv') 
df_cmip6
RATECE-PLANICA-T2M-1961-2005
mean 276.168396
stddev 8.298349

Step-3: CMIP-6 Model data historical 1961 - 2010

  • 'maximum_2m_temperature_in_the_last_24_hours'
  • 'minimum_2m_temperature_in_the_last_24_hours'

Apply bias correction to tasmin for historical

p = ds_hist['tasmin'].sel(time=slice(pd.datetime(1961, 1, 1), pd.datetime(2010, 12, 31))).sel(lat=46.5,lon=13.7, method="nearest")
t2min_h_bias_corrected = (p - mean_cmip6_1961_2005)/std_cmip6_1961_2005 * std_st_1961_2005 + mean_st_1961_2005
t2min_h_bias_corrected
/opt/conda/lib/python3.7/site-packages/ipykernel_launcher.py:1: FutureWarning: The pandas.datetime class is deprecated and will be removed from pandas in a future version. Import from datetime module instead.
  """Entry point for launching an IPython kernel.
Show/Hide data repr Show/Hide attributes
xarray.DataArray
'tasmin'
  • member_id: 1
  • time: 18261
  • dask.array<chunksize=(1, 6), meta=np.ndarray>
    Array Chunk
    Bytes 73.04 kB 372 B
    Shape (1, 18261) (1, 93)
    Count 2487 Tasks 198 Chunks
    Type float32 numpy.ndarray
    18261 1
    • height
      ()
      float64
      2.0
      axis :
      Z
      long_name :
      height
      name :
      height
      positive :
      up
      standard_name :
      height
      units :
      m
      array(2.)
    • time
      (time)
      datetime64[ns]
      1961-01-01T12:00:00 ... 2010-12-30T12:00:00
      axis :
      T
      bounds :
      time_bounds
      long_name :
      Time axis
      standard_name :
      time
      time_origin :
      1850-01-01 00:00:00
      array(['1961-01-01T12:00:00.000000000', '1961-01-02T12:00:00.000000000',
             '1961-01-03T12:00:00.000000000', ..., '2010-12-28T12:00:00.000000000',
             '2010-12-29T12:00:00.000000000', '2010-12-30T12:00:00.000000000'],
            dtype='datetime64[ns]')
    • lat
      ()
      float64
      46.69
      axis :
      Y
      long_name :
      Latitude
      standard_name :
      latitude
      units :
      degrees_north
      array(46.68510105)
    • lon
      ()
      float64
      13.5
      axis :
      X
      long_name :
      Longitude
      standard_name :
      longitude
      units :
      degrees_east
      array(13.5)
    • member_id
      (member_id)
      <U8
      'r1i1p1f2'
      array(['r1i1p1f2'], dtype='<U8')

Apply bias correction to tasmax for historical

p = ds_hist['tasmax'].sel(time=slice(pd.datetime(1961, 1, 1), pd.datetime(2010, 12, 31))).sel(lat=46.5,lon=13.7, method="nearest")
t2max_h_bias_corrected = (p - mean_cmip6_1961_2005)/std_cmip6_1961_2005 * std_st_1961_2005 + mean_st_1961_2005
t2max_h_bias_corrected
/opt/conda/lib/python3.7/site-packages/ipykernel_launcher.py:1: FutureWarning: The pandas.datetime class is deprecated and will be removed from pandas in a future version. Import from datetime module instead.
  """Entry point for launching an IPython kernel.
Show/Hide data repr Show/Hide attributes
xarray.DataArray
'tasmax'
  • member_id: 1
  • time: 18261
  • dask.array<chunksize=(1, 66), meta=np.ndarray>
    Array Chunk
    Bytes 73.04 kB 376 B
    Shape (1, 18261) (1, 94)
    Count 2455 Tasks 195 Chunks
    Type float32 numpy.ndarray
    18261 1
    • height
      ()
      float64
      2.0
      axis :
      Z
      long_name :
      height
      name :
      height
      positive :
      up
      standard_name :
      height
      units :
      m
      array(2.)
    • time
      (time)
      datetime64[ns]
      1961-01-01T12:00:00 ... 2010-12-30T12:00:00
      axis :
      T
      bounds :
      time_bounds
      long_name :
      Time axis
      standard_name :
      time
      time_origin :
      1850-01-01 00:00:00
      array(['1961-01-01T12:00:00.000000000', '1961-01-02T12:00:00.000000000',
             '1961-01-03T12:00:00.000000000', ..., '2010-12-28T12:00:00.000000000',
             '2010-12-29T12:00:00.000000000', '2010-12-30T12:00:00.000000000'],
            dtype='datetime64[ns]')
    • lat
      ()
      float64
      46.69
      axis :
      Y
      long_name :
      Latitude
      standard_name :
      latitude
      units :
      degrees_north
      array(46.68510105)
    • lon
      ()
      float64
      13.5
      axis :
      X
      long_name :
      Longitude
      standard_name :
      longitude
      units :
      degrees_east
      array(13.5)
    • member_id
      (member_id)
      <U8
      'r1i1p1f2'
      array(['r1i1p1f2'], dtype='<U8')

Step-4: CMIP-6 Model data projection ssp585

  • 'maximum_2m_temperature_in_the_last_24_hours'
  • 'minimum_2m_temperature_in_the_last_24_hours'
ds_ssp585 = dset_dict['ScenarioMIP.CNRM-CERFACS.CNRM-CM6-1-HR.ssp585.day.gr']
ds_ssp585
Show/Hide data repr Show/Hide attributes
xarray.Dataset
    • axis_nbounds: 2
    • lat: 360
    • lon: 720
    • member_id: 1
    • time: 31411
    • time_bounds
      (time, axis_nbounds)
      datetime64[ns]
      dask.array<chunksize=(15706, 2), meta=np.ndarray>
      Array Chunk
      Bytes 502.58 kB 251.30 kB
      Shape (31411, 2) (15706, 2)
      Count 22 Tasks 2 Chunks
      Type datetime64[ns] numpy.ndarray
      2 31411
    • height
      ()
      float64
      2.0
      axis :
      Z
      long_name :
      height
      name :
      height
      positive :
      up
      standard_name :
      height
      units :
      m
      array(2.)
    • time
      (time)
      datetime64[ns]
      2015-01-01T12:00:00 ... 2100-12-31T12:00:00
      axis :
      T
      bounds :
      time_bounds
      long_name :
      Time axis
      standard_name :
      time
      time_origin :
      1850-01-01 00:00:00
      array(['2015-01-01T12:00:00.000000000', '2015-01-02T12:00:00.000000000',
             '2015-01-03T12:00:00.000000000', ..., '2100-12-29T12:00:00.000000000',
             '2100-12-30T12:00:00.000000000', '2100-12-31T12:00:00.000000000'],
            dtype='datetime64[ns]')
    • lat
      (lat)
      float64
      -89.62 -89.12 ... 89.12 89.62
      axis :
      Y
      long_name :
      Latitude
      standard_name :
      latitude
      units :
      degrees_north
      array([-89.617791, -89.122671, -88.624627, ...,  88.624627,  89.122671,
              89.617791])
    • lon
      (lon)
      float64
      0.0 0.5 1.0 ... 358.5 359.0 359.5
      axis :
      X
      long_name :
      Longitude
      standard_name :
      longitude
      units :
      degrees_east
      array([  0. ,   0.5,   1. , ..., 358.5, 359. , 359.5])
    • member_id
      (member_id)
      <U8
      'r1i1p1f2'
      array(['r1i1p1f2'], dtype='<U8')
    • tas
      (member_id, time, lat, lon)
      float32
      dask.array<chunksize=(1, 95, 360, 720), meta=np.ndarray>
      cell_measures :
      area: areacella
      cell_methods :
      area: time: mean
      description :
      Near-Surface Air Temperature
      history :
      none
      interval_operation :
      900 s
      interval_write :
      1 d
      long_name :
      Near-Surface Air Temperature
      online_operation :
      average
      standard_name :
      air_temperature
      units :
      K
      Array Chunk
      Bytes 32.57 GB 98.50 MB
      Shape (1, 31411, 360, 720) (1, 95, 360, 720)
      Count 663 Tasks 331 Chunks
      Type float32 numpy.ndarray
      1 1 720 360 31411
    • tasmax
      (member_id, time, lat, lon)
      float32
      dask.array<chunksize=(1, 95, 360, 720), meta=np.ndarray>
      cell_measures :
      area: areacella
      cell_methods :
      area: mean time: maximum
      description :
      Daily Maximum Near-Surface Air Temperature
      history :
      none
      interval_operation :
      900 s
      interval_write :
      1 d
      long_name :
      Daily Maximum Near-Surface Air Temperature
      online_operation :
      maximum
      standard_name :
      air_temperature
      units :
      K
      Array Chunk
      Bytes 32.57 GB 98.50 MB
      Shape (1, 31411, 360, 720) (1, 95, 360, 720)
      Count 663 Tasks 331 Chunks
      Type float32 numpy.ndarray
      1 1 720 360 31411
    • tasmin
      (member_id, time, lat, lon)
      float32
      dask.array<chunksize=(1, 94, 360, 720), meta=np.ndarray>
      cell_measures :
      area: areacella
      cell_methods :
      area: mean time: minimum
      description :
      Daily Minimum Near-Surface Air Temperature
      history :
      none
      interval_operation :
      900 s
      interval_write :
      1 d
      long_name :
      Daily Minimum Near-Surface Air Temperature
      online_operation :
      minimum
      standard_name :
      air_temperature
      units :
      K
      Array Chunk
      Bytes 32.57 GB 97.46 MB
      Shape (1, 31411, 360, 720) (1, 94, 360, 720)
      Count 671 Tasks 335 Chunks
      Type float32 numpy.ndarray
      1 1 720 360 31411
  • grid :
    data regridded to a 359 gaussian grid (360x720 latlon) from a native atmosphere T359l reduced gaussian grid
    variant_label :
    r1i1p1f2
    grid_label :
    gr
    references :
    http://www.umr-cnrm.fr/cmip6/references
    parent_activity_id :
    C M I P
    external_variables :
    areacella
    xios_commit :
    1442-shuffle
    CMIP6_CV_version :
    cv=6.2.3.0-7-g2019642
    parent_time_units :
    days since 1850-01-01 00:00:00
    product :
    model-output
    realm :
    atmos
    institution_id :
    CNRM-CERFACS
    branch_time_in_parent :
    60265.0
    branch_method :
    standard
    institution :
    CNRM (Centre National de Recherches Meteorologiques, Toulouse 31057, France), CERFACS (Centre Europeen de Recherche et de Formation Avancee en Calcul Scientifique, Toulouse 31057, France)
    license :
    CMIP6 model data produced by CNRM-CERFACS is licensed under a Creative Commons Attribution-NonCommercial-ShareAlike 4.0 International License (https://creativecommons.org/licenses). Consult https://pcmdi.llnl.gov/CMIP6/TermsOfUse for terms of use governing CMIP6 output, including citation requirements and proper acknowledgment. Further information about this data, including some limitations, can be found via the further_info_url (recorded as a global attribute in this file) and at http://www.umr-cnrm.fr/cmip6/. The data producers and data providers make no warranty, either express or implied, including, but not limited to, warranties of merchantability and fitness for a particular purpose. All liabilities arising from the supply of the information (including any liability arising in negligence) are excluded to the fullest extent permitted by law.
    parent_source_id :
    CNRM-CM6-1-HR
    intake_esm_varname :
    tasmin
    sub_experiment_id :
    none
    parent_mip_era :
    CMIP6
    status :
    2020-02-02;created; by gcs.cmip6.ldeo@gmail.com
    mip_era :
    CMIP6
    history :
    none
    nominal_resolution :
    50 km
    branch_time_in_child :
    60265.0
    parent_experiment_id :
    h i s t o r i c a l
    creation_date :
    2019-09-13T14:50:53Z
    dr2xml_version :
    1.16
    source_type :
    AOGCM
    EXPID :
    CNRM-CM6-1-HR_ssp585_r1i1p1f2
    source :
    CNRM-CM6-1-HR (2017): aerosol: prescribed monthly fields computed by TACTIC_v2 scheme atmos: Arpege 6.3 (T359; Gaussian Reduced with 181724 grid points in total distributed over 360 latitude circles (with 720 grid points per latitude circle between 32.2degN and 32.2degS reducing to 18 grid points per latitude circle at 89.6degN and 89.6degS); 91 levels; top level 78.4 km) atmosChem: OZL_v2 land: Surfex 8.0c ocean: Nemo 3.6 (eORCA025, tripolar primarily 1/4deg; 1442 x 1050 longitude/latitude; 75 levels; top grid cell 0-1 m) seaIce: Gelato 6.1
    sub_experiment :
    none
    source_id :
    CNRM-CM6-1-HR
    dr2xml_md5sum :
    45d4369d889ddfb8149d771d8625e9ec
    table_id :
    day
    activity_id :
    ScenarioMIP
    variable_id :
    tasmin
    frequency :
    day
    realization_index :
    1
    parent_variant_label :
    r1i1p1f2
    initialization_index :
    1
    forcing_index :
    2
    contact :
    contact.cmip@meteo.fr
    physics_index :
    1
    data_specs_version :
    01.00.21
    experiment :
    update of RCP8.5 based on SSP5
    nemo_gelato_commit :
    84a9e3f161dade7_8250e198106a168
    title :
    CNRM-CM6-1-HR model output prepared for CMIP6 and ScenarioMIP / ssp585 simulation
    description :
    Future scenario with high radiative forcing by the end of century. Following approximately RCP8.5 global forcing pathway but with new forcing based on SSP5. Concentration-driven. As a tier 2 option, this simulation should be extended to year 2300
    Conventions :
    CF-1.7 CMIP-6.2
    tracking_id :
    hdl:21.14100/b51b13df-d194-4941-affb-64c0236ffc79 hdl:21.14100/25c93c65-3914-4e09-b48c-d9b92ae30267 hdl:21.14100/e652365f-b1d4-4d63-b0fb-4c88f553cda5 hdl:21.14100/e8084d26-5f1a-483f-8eca-0287a7faaa6e hdl:21.14100/084cef3d-d1fc-4624-943f-0696308508a1 hdl:21.14100/c348f370-d52c-4a5f-8a64-3e7392766c53
    experiment_id :
    ssp585
    further_info_url :
    https://furtherinfo.es-doc.org/CMIP6.CNRM-CERFACS.CNRM-CM6-1-HR.ssp585.none.r1i1p1f2
    arpege_minor_version :
    6.3.3

Apply bias correction to tasmin for prevision 2021-2100

p = ds_ssp585['tasmin'].sel(time=slice(pd.datetime(2021, 1, 1), pd.datetime(2100, 12, 31))).sel(lat=46.5,lon=13.7, method="nearest")
t2min_p_bias_corrected = (p - mean_cmip6_1961_2005)/std_cmip6_1961_2005 * std_st_1961_2005 + mean_st_1961_2005
t2min_p_bias_corrected
/opt/conda/lib/python3.7/site-packages/ipykernel_launcher.py:1: FutureWarning: The pandas.datetime class is deprecated and will be removed from pandas in a future version. Import from datetime module instead.
  """Entry point for launching an IPython kernel.
Show/Hide data repr Show/Hide attributes
xarray.DataArray
'tasmin'
  • member_id: 1
  • time: 29218
  • dask.array<chunksize=(1, 64), meta=np.ndarray>
    Array Chunk
    Bytes 116.87 kB 376 B
    Shape (1, 29218) (1, 94)
    Count 2543 Tasks 312 Chunks
    Type float32 numpy.ndarray
    29218 1
    • height
      ()
      float64
      2.0
      axis :
      Z
      long_name :
      height
      name :
      height
      positive :
      up
      standard_name :
      height
      units :
      m
      array(2.)
    • time
      (time)
      datetime64[ns]
      2021-01-01T12:00:00 ... 2100-12-30T12:00:00
      axis :
      T
      bounds :
      time_bounds
      long_name :
      Time axis
      standard_name :
      time
      time_origin :
      1850-01-01 00:00:00
      array(['2021-01-01T12:00:00.000000000', '2021-01-02T12:00:00.000000000',
             '2021-01-03T12:00:00.000000000', ..., '2100-12-28T12:00:00.000000000',
             '2100-12-29T12:00:00.000000000', '2100-12-30T12:00:00.000000000'],
            dtype='datetime64[ns]')
    • lat
      ()
      float64
      46.69
      axis :
      Y
      long_name :
      Latitude
      standard_name :
      latitude
      units :
      degrees_north
      array(46.68510105)
    • lon
      ()
      float64
      13.5
      axis :
      X
      long_name :
      Longitude
      standard_name :
      longitude
      units :
      degrees_east
      array(13.5)
    • member_id
      (member_id)
      <U8
      'r1i1p1f2'
      array(['r1i1p1f2'], dtype='<U8')

Apply bias correction to tasmax for prevision 2021-2100

p = ds_ssp585['tasmax'].sel(time=slice(pd.datetime(2021, 1, 1), pd.datetime(2100, 12, 31))).sel(lat=46.5,lon=13.7, method="nearest")
t2max_p_bias_corrected = (p - mean_cmip6_1961_2005)/std_cmip6_1961_2005 * std_st_1961_2005 + mean_st_1961_2005
t2max_p_bias_corrected
/opt/conda/lib/python3.7/site-packages/ipykernel_launcher.py:1: FutureWarning: The pandas.datetime class is deprecated and will be removed from pandas in a future version. Import from datetime module instead.
  """Entry point for launching an IPython kernel.
Show/Hide data repr Show/Hide attributes
xarray.DataArray
'tasmax'
  • member_id: 1
  • time: 29218
  • dask.array<chunksize=(1, 88), meta=np.ndarray>
    Array Chunk
    Bytes 116.87 kB 380 B
    Shape (1, 29218) (1, 95)
    Count 2511 Tasks 308 Chunks
    Type float32 numpy.ndarray
    29218 1
    • height
      ()
      float64
      2.0
      axis :
      Z
      long_name :
      height
      name :
      height
      positive :
      up
      standard_name :
      height
      units :
      m
      array(2.)
    • time
      (time)
      datetime64[ns]
      2021-01-01T12:00:00 ... 2100-12-30T12:00:00
      axis :
      T
      bounds :
      time_bounds
      long_name :
      Time axis
      standard_name :
      time
      time_origin :
      1850-01-01 00:00:00
      array(['2021-01-01T12:00:00.000000000', '2021-01-02T12:00:00.000000000',
             '2021-01-03T12:00:00.000000000', ..., '2100-12-28T12:00:00.000000000',
             '2100-12-29T12:00:00.000000000', '2100-12-30T12:00:00.000000000'],
            dtype='datetime64[ns]')
    • lat
      ()
      float64
      46.69
      axis :
      Y
      long_name :
      Latitude
      standard_name :
      latitude
      units :
      degrees_north
      array(46.68510105)
    • lon
      ()
      float64
      13.5
      axis :
      X
      long_name :
      Longitude
      standard_name :
      longitude
      units :
      degrees_east
      array(13.5)
    • member_id
      (member_id)
      <U8
      'r1i1p1f2'
      array(['r1i1p1f2'], dtype='<U8')

Step-5: Favourable conditions to produce artificial snow

  • daily minimum temperature below 0 °C
  • daily maximum temperature not above 3 °C

Favourable conditions to produce artificial snow for period 1961 - 2010

  • t2min_h_bias_corrected < 0
  • t2max_h_bias_corrected <= 3
nb_favourable_h = t2min_h_bias_corrected.where((t2min_h_bias_corrected < 0) & (t2max_h_bias_corrected <= 3)).groupby('time.year').count()
nb_favourable_h
Show/Hide data repr Show/Hide attributes
xarray.DataArray
'tasmin'
  • member_id: 1
  • year: 50
  • dask.array<chunksize=(1, 1), meta=np.ndarray>
    Array Chunk
    Bytes 400 B 8 B
    Shape (1, 50) (1, 1)
    Count 10488 Tasks 50 Chunks
    Type int64 numpy.ndarray
    50 1
    • height
      ()
      float64
      2.0
      axis :
      Z
      long_name :
      height
      name :
      height
      positive :
      up
      standard_name :
      height
      units :
      m
      array(2.)
    • lat
      ()
      float64
      46.69
      axis :
      Y
      long_name :
      Latitude
      standard_name :
      latitude
      units :
      degrees_north
      array(46.68510105)
    • lon
      ()
      float64
      13.5
      axis :
      X
      long_name :
      Longitude
      standard_name :
      longitude
      units :
      degrees_east
      array(13.5)
    • member_id
      (member_id)
      <U8
      'r1i1p1f2'
      array(['r1i1p1f2'], dtype='<U8')
    • year
      (year)
      int64
      1961 1962 1963 ... 2008 2009 2010
      array([1961, 1962, 1963, 1964, 1965, 1966, 1967, 1968, 1969, 1970, 1971, 1972,
             1973, 1974, 1975, 1976, 1977, 1978, 1979, 1980, 1981, 1982, 1983, 1984,
             1985, 1986, 1987, 1988, 1989, 1990, 1991, 1992, 1993, 1994, 1995, 1996,
             1997, 1998, 1999, 2000, 2001, 2002, 2003, 2004, 2005, 2006, 2007, 2008,
             2009, 2010])

Favourable conditions to produce artificial snow for period 2021 - 2100

  • t2min_p_bias_corrected < 0
  • t2max_p_bias_corrected <= 3
nb_favourable_p = t2min_p_bias_corrected.where((t2min_p_bias_corrected < 0) & (t2max_p_bias_corrected <= 3)).groupby('time.year').count()
nb_favourable_p
Show/Hide data repr Show/Hide attributes
xarray.DataArray
'tasmin'
  • member_id: 1
  • year: 80
  • dask.array<chunksize=(1, 1), meta=np.ndarray>
    Array Chunk
    Bytes 640 B 8 B
    Shape (1, 80) (1, 1)
    Count 13807 Tasks 80 Chunks
    Type int64 numpy.ndarray
    80 1
    • height
      ()
      float64
      2.0
      axis :
      Z
      long_name :
      height
      name :
      height
      positive :
      up
      standard_name :
      height
      units :
      m
      array(2.)
    • lat
      ()
      float64
      46.69
      axis :
      Y
      long_name :
      Latitude
      standard_name :
      latitude
      units :
      degrees_north
      array(46.68510105)
    • lon
      ()
      float64
      13.5
      axis :
      X
      long_name :
      Longitude
      standard_name :
      longitude
      units :
      degrees_east
      array(13.5)
    • member_id
      (member_id)
      <U8
      'r1i1p1f2'
      array(['r1i1p1f2'], dtype='<U8')
    • year
      (year)
      int64
      2021 2022 2023 ... 2098 2099 2100
      array([2021, 2022, 2023, 2024, 2025, 2026, 2027, 2028, 2029, 2030, 2031, 2032,
             2033, 2034, 2035, 2036, 2037, 2038, 2039, 2040, 2041, 2042, 2043, 2044,
             2045, 2046, 2047, 2048, 2049, 2050, 2051, 2052, 2053, 2054, 2055, 2056,
             2057, 2058, 2059, 2060, 2061, 2062, 2063, 2064, 2065, 2066, 2067, 2068,
             2069, 2070, 2071, 2072, 2073, 2074, 2075, 2076, 2077, 2078, 2079, 2080,
             2081, 2082, 2083, 2084, 2085, 2086, 2087, 2088, 2089, 2090, 2091, 2092,
             2093, 2094, 2095, 2096, 2097, 2098, 2099, 2100])
nb_favourable = xr.merge([nb_favourable_h, nb_favourable_p])
distributed.comm.tcp - WARNING - Closing dangling stream in <TCP  local=tcp://127.0.0.1:54544 remote=tcp://127.0.0.1:45859>
nb_favourable
Show/Hide data repr Show/Hide attributes
xarray.Dataset
    • member_id: 1
    • year: 130
    • year
      (year)
      int64
      1961 1962 1963 ... 2098 2099 2100
      array([1961, 1962, 1963, 1964, 1965, 1966, 1967, 1968, 1969, 1970, 1971, 1972,
             1973, 1974, 1975, 1976, 1977, 1978, 1979, 1980, 1981, 1982, 1983, 1984,
             1985, 1986, 1987, 1988, 1989, 1990, 1991, 1992, 1993, 1994, 1995, 1996,
             1997, 1998, 1999, 2000, 2001, 2002, 2003, 2004, 2005, 2006, 2007, 2008,
             2009, 2010, 2021, 2022, 2023, 2024, 2025, 2026, 2027, 2028, 2029, 2030,
             2031, 2032, 2033, 2034, 2035, 2036, 2037, 2038, 2039, 2040, 2041, 2042,
             2043, 2044, 2045, 2046, 2047, 2048, 2049, 2050, 2051, 2052, 2053, 2054,
             2055, 2056, 2057, 2058, 2059, 2060, 2061, 2062, 2063, 2064, 2065, 2066,
             2067, 2068, 2069, 2070, 2071, 2072, 2073, 2074, 2075, 2076, 2077, 2078,
             2079, 2080, 2081, 2082, 2083, 2084, 2085, 2086, 2087, 2088, 2089, 2090,
             2091, 2092, 2093, 2094, 2095, 2096, 2097, 2098, 2099, 2100])
    • height
      ()
      float64
      2.0
      axis :
      Z
      long_name :
      height
      name :
      height
      positive :
      up
      standard_name :
      height
      units :
      m
      array(2.)
    • lat
      ()
      float64
      46.69
      axis :
      Y
      long_name :
      Latitude
      standard_name :
      latitude
      units :
      degrees_north
      array(46.68510105)
    • lon
      ()
      float64
      13.5
      axis :
      X
      long_name :
      Longitude
      standard_name :
      longitude
      units :
      degrees_east
      array(13.5)
    • member_id
      (member_id)
      <U8
      'r1i1p1f2'
      array(['r1i1p1f2'], dtype='<U8')
    • tasmin
      (member_id, year)
      float64
      dask.array<chunksize=(1, 51), meta=np.ndarray>
      Array Chunk
      Bytes 1.04 kB 408 B
      Shape (1, 130) (1, 51)
      Count 14692 Tasks 80 Chunks
      Type float64 numpy.ndarray
      130 1
series = nb_favourable.tasmin.to_series()
series = series.reset_index(level='member_id').drop(columns=['member_id'])

series.index = pd.to_datetime(series.index,  format='%Y')
series
tasmin
year
1961-01-01 67.0
1962-01-01 51.0
1963-01-01 36.0
1964-01-01 62.0
1965-01-01 53.0
... ...
2096-01-01 5.0
2097-01-01 9.0
2098-01-01 1.0
2099-01-01 0.0
2100-01-01 0.0

130 rows × 1 columns

series.to_csv("nb_favourable_snow_cmip6.csv")

Step-6: Plotting (group per decades)

series10YS = series.groupby(pd.Grouper(freq='10YS')).mean()
import matplotlib.pyplot as plt
from datetime import datetime
from datetime import timedelta
from dateutil.relativedelta import relativedelta

fig = plt.figure(1, figsize=[20,10])
ax = plt.subplot(1, 1, 1)
series10YS.plot.bar(ax=ax)
plt.axhline(y=30, color='r', linestyle='-', linewidth=3)
labels = [datetime.strptime(item.get_text(), '%Y-%m-%d %H:%M:%S').strftime("%Y") + '-' + 
            (datetime.strptime(item.get_text() , '%Y-%m-%d %H:%M:%S') +  relativedelta(years=9)).strftime("%Y")  for item in ax.get_xticklabels()] 
ax.set_xticklabels(labels, rotation=20, fontsize = 15)
ax.set_xlabel('Decade', fontsize = 20)
ax.set_ylabel('Average number of favourable days per year\n for the production of artifical snow', fontsize = 20)
plt.title("RATECE-PLANICA ski station (Slovenia) \n A dying ski tourism destination under SSP585 ", fontsize=30)
ax.legend(labels=['Threshold (30 days)','CNRM-CM6-1-HR'], fontsize=30)
plt.savefig("nb_favourable_snow_cmip6.png")
client.shutdown()