
Juan's olive grove - temperature
The south of Spain (andalusia) is famous for its olive groves and olive oil production. However olive trees are sensitive to climate change. Changes in temperature and precipitation can cause changing flowering times (Gabaldón-Leal et al., 2017), reduce production and may even result in abandoned olive groves when farmers are forced to move to different areas. Olive production is a culturally and economically crucial industry to the region therefore adaptation is necessary. Adaptation measures include but are not limited to: different and more precise irrigation practices (Lorite et al., 2018), change of location (Ropero, Rumí, & Aguilera, 2018), change of crop.
In this case study we will take a look at how climate data can help two olive grove owners, Juan and Carlos, in their olive farming.
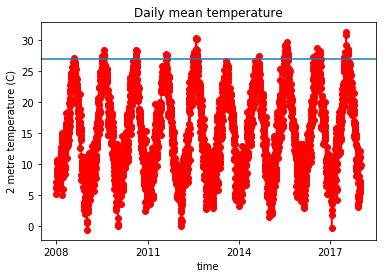
Farmer Juan has an olive grove between Granada and Malaga (lat:37 lon:-4). The specific breed of olive tree in his grove study cannot flower if the temperature in reaches above 27 degrees. With the Toolbox you can plot a graph of the temperature fluctuations from 2008 to 2017.

Question
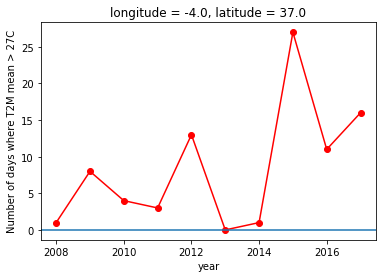
How many years did the mean daily temperature exceed 27°C in the period of 2008-2017 at Juan's olive grove?
import cdsapi

c = cdsapi.Client()

c.retrieve(
    'reanalysis-era5-single-levels',
    {
        'product_type': 'reanalysis',
        'variable': '2m_temperature',
        'year': [
            '2008', '2009', '2010',
            '2011', '2012', '2013',
            '2014', '2015', '2016',
            '2017',
        ],
        'month': [
            '01', '02', '03',
            '04', '05', '06',
            '07', '08', '09',
            '10', '11', '12',
        ],
        'day': [
            '01', '02', '03',
            '04', '05', '06',
            '07', '08', '09',
            '10', '11', '12',
            '13', '14', '15',
            '16', '17', '18',
            '19', '20', '21',
            '22', '23', '24',
            '25', '26', '27',
            '28', '29', '30',
            '31',
        ],
       'area': [37.5, -4.5, 36.5, -3.5], # North, West, South, East. Default: global
        'time': [
            '00:00', '01:00', '02:00',
            '03:00', '04:00', '05:00',
            '06:00', '07:00', '08:00',
            '09:00', '10:00', '11:00',
            '12:00', '13:00', '14:00',
            '15:00', '16:00', '17:00',
            '18:00', '19:00', '20:00',
            '21:00', '22:00', '23:00',
        ],
        'format': 'netcdf',
    },
    'era5_t2m_2008-2017_hourly.nc')
import matplotlib.pyplot as plt
import xarray as xr
import cftime
%matplotlib inline
filename = 'era5_t2m_2008-2017_hourly.nc'
dset = xr.open_dataset(filename, decode_times=True, use_cftime=True)
dset
dset_daily_mean = dset.sel(latitude=37.0, longitude=-4, method="nearest").resample(time='1D').mean()
dset_daily_mean.time
(dset_daily_mean['t2m']-273.15).plot.line('ro-')
plt.ylabel("2 metre temperature (C)")
plt.title("Daily mean temperature")
plt.axhline(y=27)
dset_daily_mean_greater_27 = dset_daily_mean.where(dset_daily_mean['t2m'] > 27 + 273.15).groupby('time.year').count()
dset_daily_mean_greater_27['t2m'].plot.line('ro-')
plt.ylabel("Number of days where T2M mean > 27C")
plt.axhline(y=0)
dset_daily_mean_greater_27['t2m']
nyears = dset_daily_mean_greater_27.where(dset_daily_mean_greater_27['t2m']>0).count()
print("In the period of 2008-2017, the mean daily temperature exceeded 27C ", nyears['t2m'].values, " years at Juan's olive grove")
Same using cdo
- you can use cdo to compute daily mean values
!cdo -daymean era5_t2m_2008-2017_hourly.nc era5_t2m_2008-2017_daily_mean.nc
filename = 'era5_t2m_2008-2017_daily_mean.nc'
dset = xr.open_dataset(filename, decode_times=True, use_cftime=True)
dset_daily_mean = dset.sel(latitude=37.0, longitude=-4, method="nearest")
dset_daily_mean_greater_27 = dset_daily_mean.where(dset_daily_mean['t2m'] > 27 + 273.15).groupby('time.year').count()
dset_daily_mean_greater_27
nyears = dset_daily_mean_greater_27.where(dset_daily_mean_greater_27['t2m']>0).count()
print("In the period of 2008-2017, the mean daily temperature exceeded 27C ", nyears['t2m'].values, " years at Juan's olive grove")
Maximum daily temperature
Farmer Juan's olive trees cannot flower when the temperature is above 27 degrees. In the previous exercise we analyzed the mean daily temperature but actually we need to look at the maximum daily temperature to find out which years were problematic for Farmer Juan.
The daily temperature in Andalusia reaches its maximum at 14:00h. To get this maximum daily temperature we need to make some adjustments to the python script.
dset_max_daily = dset.sel(latitude=37.0, longitude=-4, time = dset.time.dt.hour.isin([14, 14]), method="nearest")
dset_daily_max_greater_27 = dset_max_daily.where(dset_max_daily['t2m'] > 27 + 273.15).groupby('time.year').count()
nyears = dset_daily_max_greater_27.where(dset_daily_max_greater_27['t2m']>0).count()
print("In the period of 2008-2017, the mean daily temperature exceeded 27C ", nyears['t2m'].values, " years at Juan's olive grove")