Overview
Teaching: 20 minObjectives
- Pre-process the NorESM output on irregular grid to commonly used grid system
NorESM horizontal and vertical grid system
Needs to remap irregular model grids to standard grid to facilitate comparision with observations and multiple model intercomparision.

Convert CAM hybrid-sigma coordinate to pressure levels
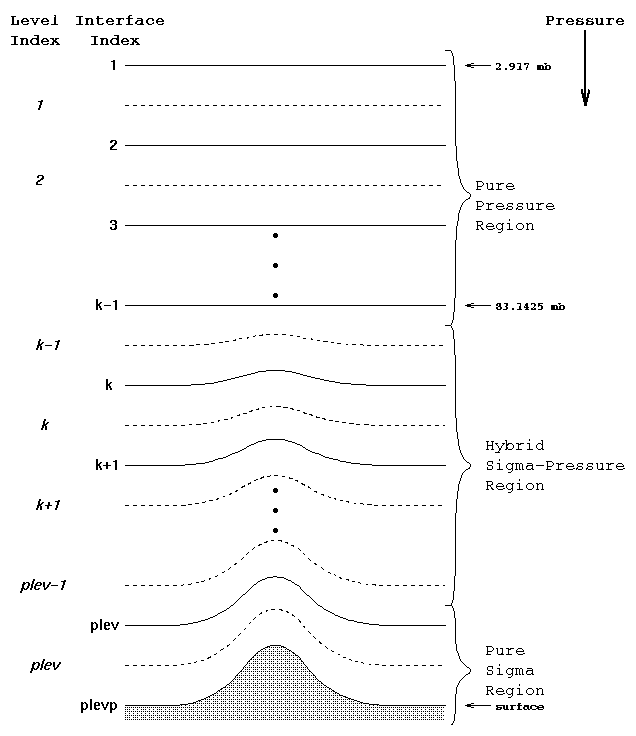 |
The vertical coordinate of CAM is a hybrid sigma-pressure system. In this system, the upper regions of the atmosphere are discretized by pressure only. Lower vertical levels use the sigma (i.e. p/ps) vertical coordinate smoothly merged in, with the lowest levels being pure sigma. A schematic representation of the hybrid vertical coordinate and vertical indexing is presented in the right. |
# Extract variable
ncks -O -v ${VAR},ilev $filename var_tmp.nc
# Add layer interface 'ilev' as bounds of vertical coordinate 'lev’
ncatted -a bounds,lev,c,c,"ilev" var_tmp.nc
# Interpolate from hybrid sigma-pressure to pressure levels
cdo ml2pl,3000.,5000.,7000.,10000.,15000.,20000.,25000.,30000.,35000.,40000., \
    var_tmp.nc var_ml2pl.nc
# Convert Pa to hPA
ncap2 -O -s 'plev=plev/100' var_ml2pl.nc var_ml2pl.nc
# Change the "units" from Pa to hPa
ncatted -a units,plev,m,c,"hPa" var_ml2pl.nc
# Make zonal mean
cdo -s zonmean var_ml2pl.nc var_ml2pl_zm.nc
# View result
ncview var_ml2pl2_zm.nc &
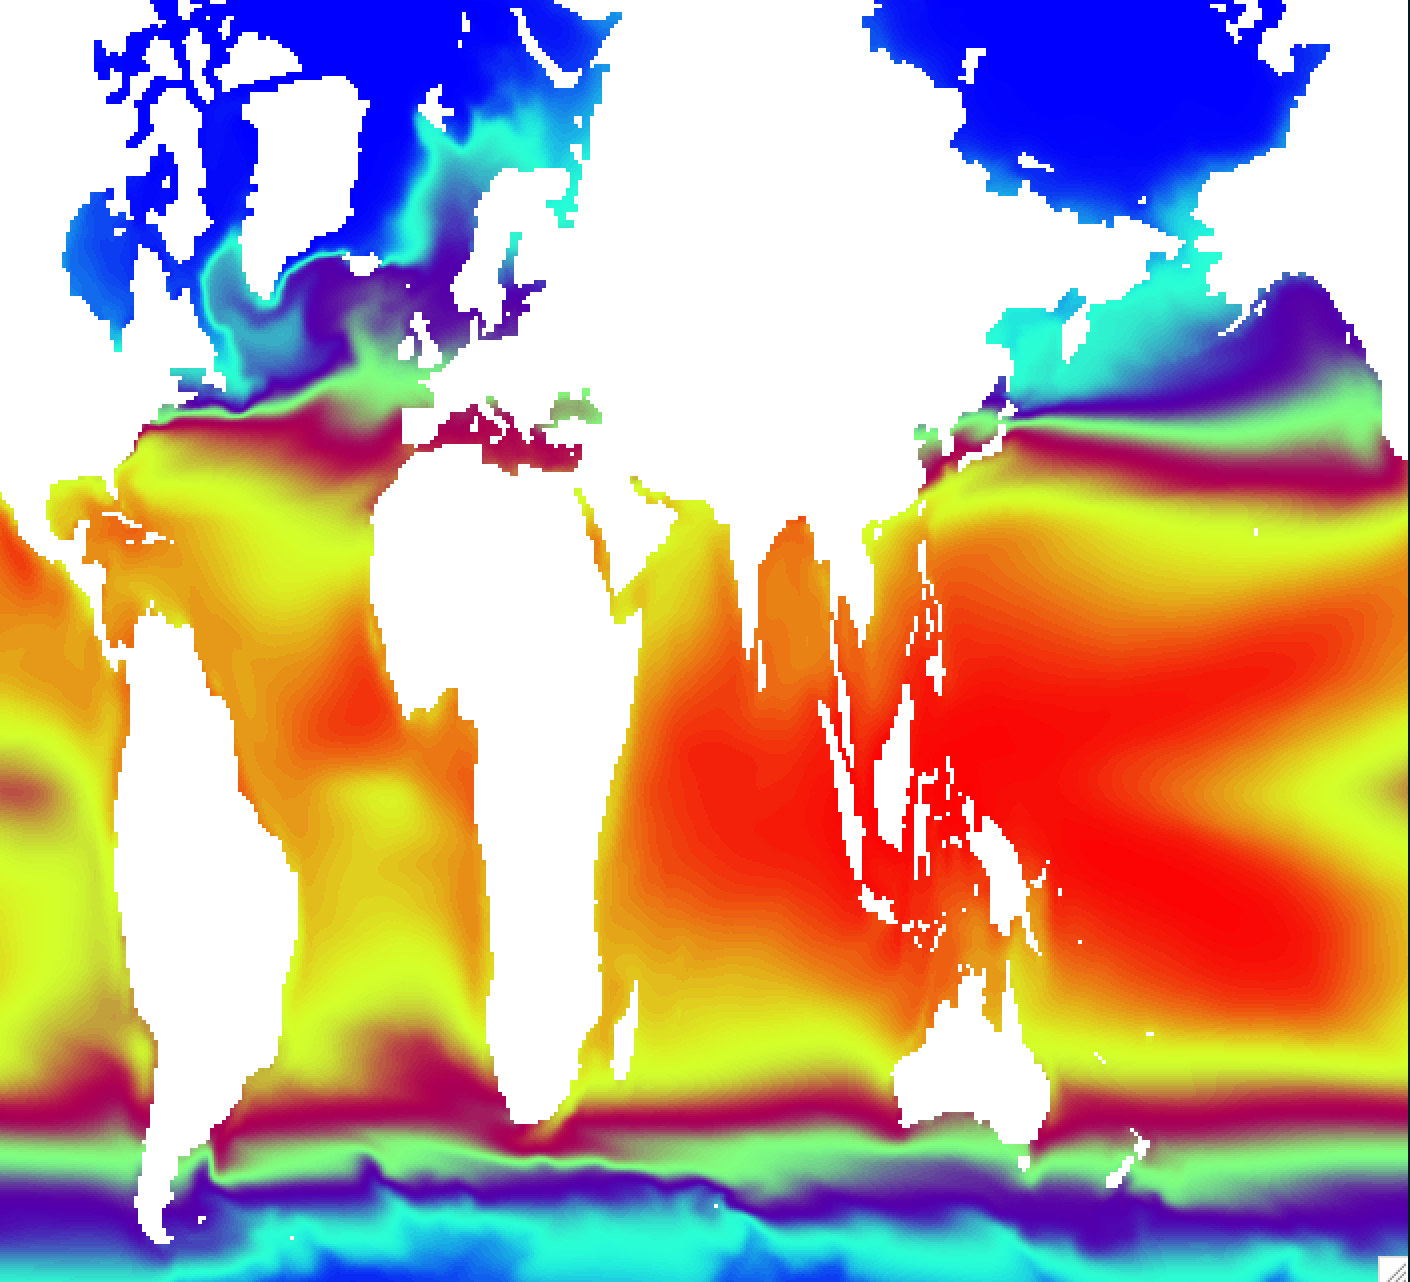
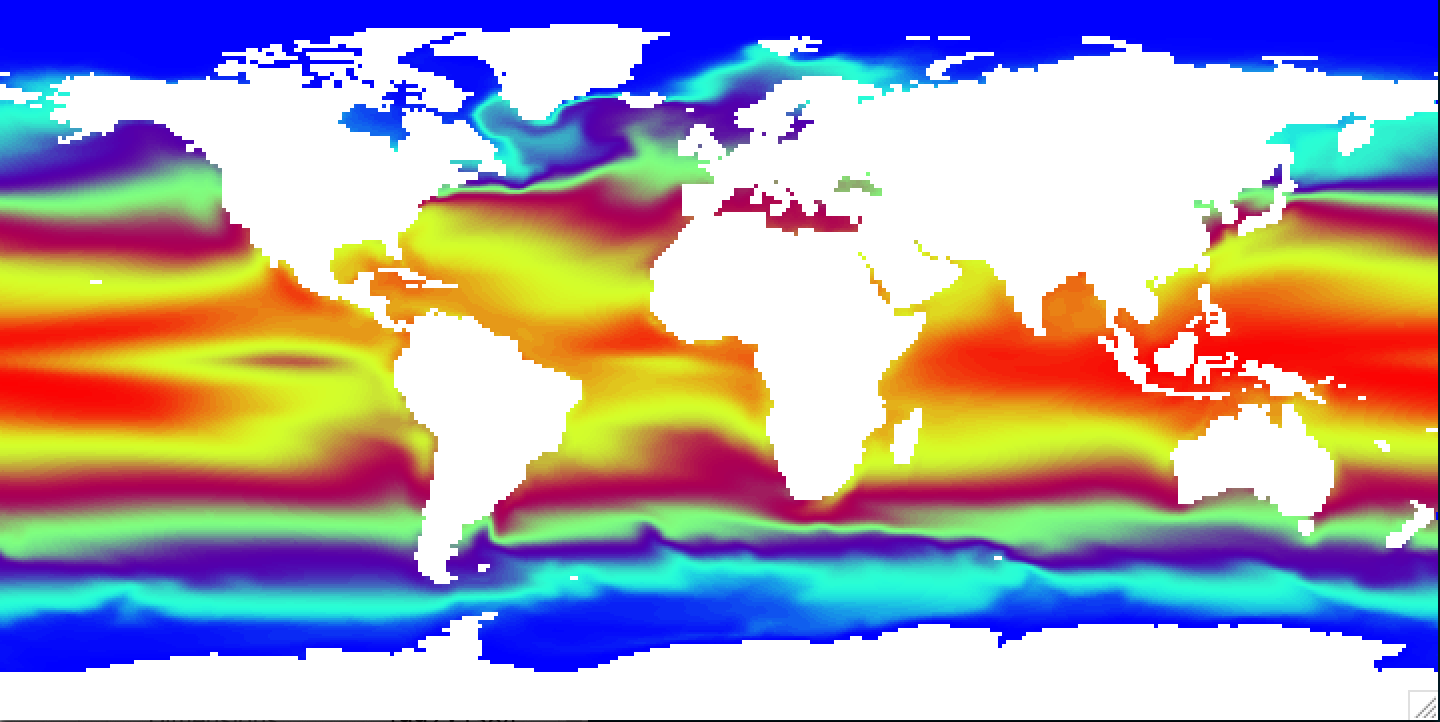
Regrid ocean tripolar grid to 1x1 degree grid
# Regrid data
ncks -A -v plat,plon grid.nc blom_sst.nc
cdo -O remapbil,global_1 blom_sst.nc blom_sst_1x1d.nc

# Make difference between model and observation
ncdiff -O blom_sst_1x1d.nc HadISST_sst.nc sst_diff.nc
Rotate vector from model
i,jdirection to zonal and meridional directions.
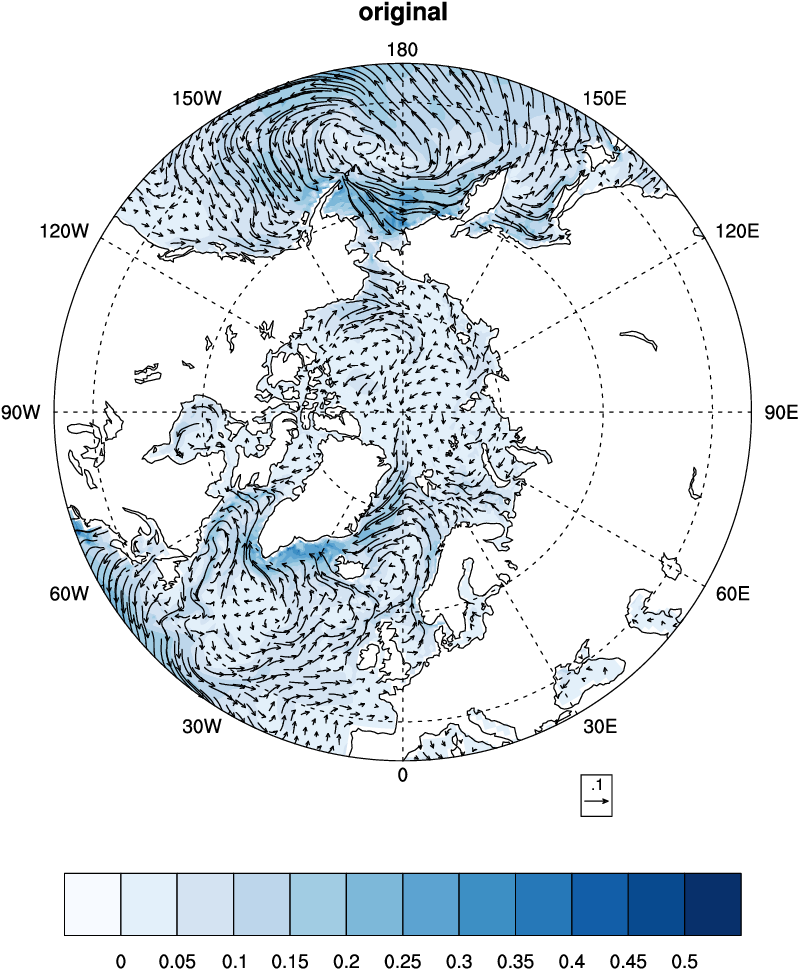
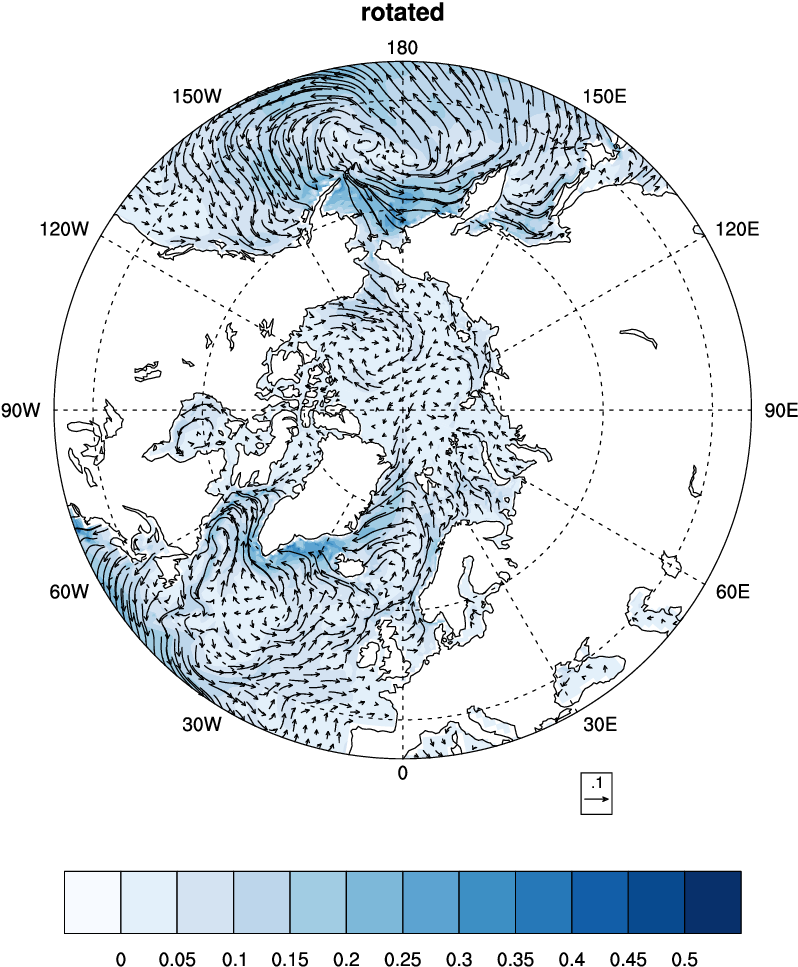
Rotate BLOM vectors using NCO
# Extract ubaro,vbaro
ncks -O -v ubaro,vbaro $filename uv.nc
# Add vector angle to micom variable file
ncks -A -v angle grid.nc uv.nc
# Generate roated new verctors
ncap2 -O -s "urot=ubaro*cos(angle)-vbaro*sin(angle);vrot=ubaro*sin(angle)+vbaro*cos(angle)"
    \ uv.nc uvrot.nc
# View the data
ncview uvrot.nc
plot with CDO magics libraries
https://code.mpimet.mpg.de/projects/cdo/embedded/cdo_magics.pdf
# load cdo with magics
conda activate /projects/NS2345K/diagnostics/cdomagics
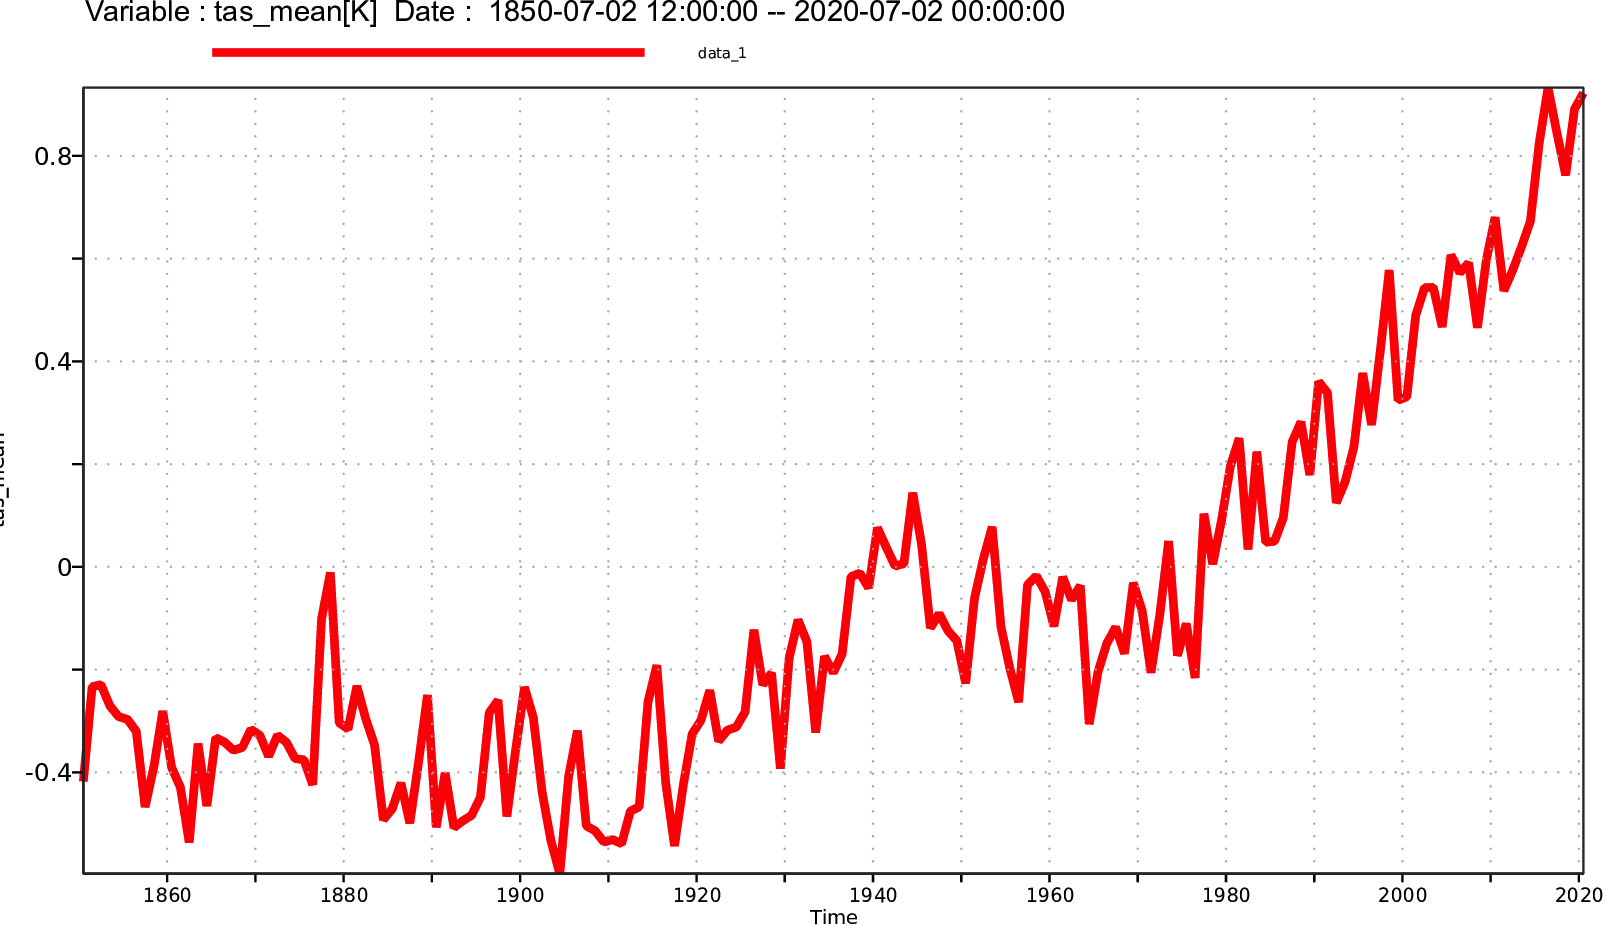
Time series plot with CDO with magics
cdo graph,device=png -yearmonmean -fldmean -sellevidx,32 -select,name=T NHIST_f19_tn14_20190710.cam.h0.*.nc /path/to/output//figure1
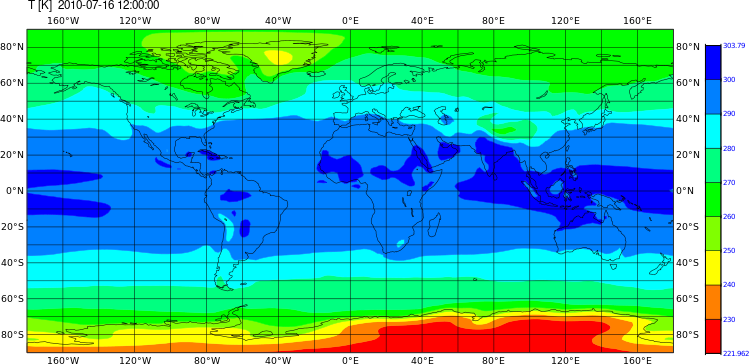
Shaded plot with CDO with magics
cdo shaded,device=png -timmean -sellevidx,32 -select,name=T NHIST_f19_tn14_20190710.cam.h0.2010-*.nc /path/to/output/figure2
Grid fill plot with CDO with magics
cdo grfill,device=png -timmean -sellevidx,32 -select,name=T NHIST_f19_tn14_20190710.cam.h0.2010-*.nc /path/to/output/figure3
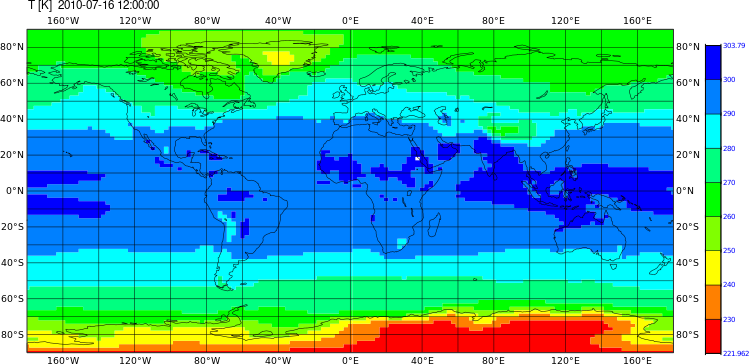
Changing the color and countour settings, etc
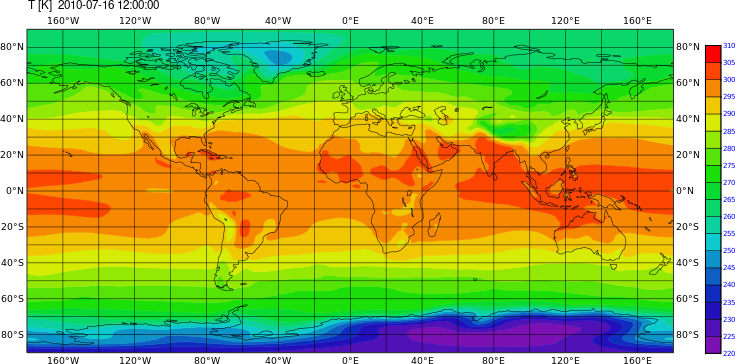
cdo shaded,device=png,min=220,max=310,interval=5,colour_min=violet,colour_max=red,colour_triad=cw \
    -timmean -sellevidx,32 -select,name=T NHIST_f19_tn14_20190710.cam.h0.2010-*.nc /path/to/output/figure4
