CMIP6 evaluation of AOD against ground-based observations and MERRA2 
Motivation
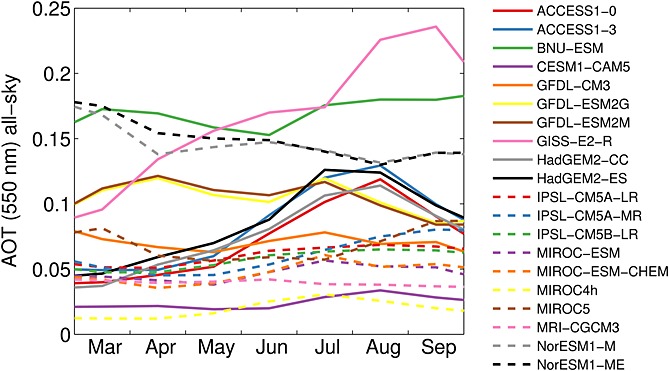 |
Fig. 1: Glantz et al.,2014 Climatological seasonal cycles of all‐sky AOT averaged for the Svalbard area (75°N–82°N, 10°W–40°E) in 20 global climate models participating in the CMIP5 project. The climatological cycles are based on the period 1980–2004 of the CMIP5's “historical” experiment. Information on individual models can be found at http://cmip‐pcmdi.llnl.gov/cmip5. |
- Seasonal variation over Svalbard area
- Lowest AOD during summer
- CMIP5 against remote sensing
- $\rightarrow$ underestimation during spring
- $\rightarrow$ overestimation during winter
Observations, Re-Analysis, historical simulation of CMIP6
AERONET (AERosol RObotic NETwork)
- Sunphotometer at Arctic Station lat > 66$^{\circ}$N (total 14)
MERRA2 (Modern-Era Retrospective analysis for Research and Applications 2)
- satellite reanalysis since 1980
- horizontal resolution: 0.5 - 0.625 $^{\circ}$
| CMIP6 Models | |
|---|---|
| GFDL-CM4 | E3SM-1-0 |
| CanESM5 | MIROC-ES2L |
| NorESM2-LM | CNRM-CM6-1 |
| CESM2-WACCM | IPSL-CM6A-LR |
| GFDL-ESM4 | CESM2 |
 |
Validation of AOD from MERRA2 with AERONET 

Evaluation of Arctic AOD from CMIP6 to MERRA2 

AOD evaluation for Svalbard Region 

AOD zonal evaluation 

Conclusion & Future Work
AERONET - MERRA2
- MERRA2 is higher than AERONET AOD
- MERRA2 'stations' compare well to Arctic AOD average
MERRA2 - CMIP6
- Arctic
- CanESM5 overestimates during spring, too low during summer
- still underestimation during spring
- Svalbard region
- CanESM5 within MERRA2 variability
Zonal average
- overestimation in NH (CanESM5)
- overestimation in SH (NorESM2-LM)
- $\rightarrow$ compare all models, correlate the ones which fit will $\rightarrow$ Why do they fit better?